




*Kelley Blue Book average transaction prices do not include applied consumer incentives
Used-Truck Prices October 2019
Average New Pickup Truck Prices Up Year-Over-Year
Trucks have shown the most strength of any segment with full-size trucks up 3%, while Kelley Blue Book shows midsize pickups rose 6%, aided by new and redesigned models.
November 1, 2019

Retail pickup sales were stronger in October than a year ago.
Photo: Ford
1 min to read
The valuation analysts at Kelley Blue Book today reported the estimated average transaction price for a light vehicle was $38,259 in October. Overall new-vehicle prices increased $1,064 (up 2.9%) from October 2018, while decreasing $141 (0.4%) from September.
Manufacturers are focusing incentive programs on the increasingly competitive utility segments, helping make those vehicles more affordable to consumers. Trucks have shown the most strength of any segment with full-size trucks up 3%, while midsize pickups rose 6%, aided by new and redesigned models.
"Average transaction prices were generally favorable for most automakers, as the industry average climbed 3% year-over-year, partially due to the shifting sales mix from cars to trucks and SUVs," said Tim Fleming, analyst for Kelley Blue Book. "However, car prices did grow by 2% in October, their biggest improvement in nearly a year."
Segment | Oct. 2019 Transaction Price Avg. | Sept. 2019 Transaction Price Avg. | 2018 Transaction Price (Avg.)* | Percent Change September 2019 to October 2019* | Percent Change Oct. 2018- Oct. 2019 |
|---|---|---|---|---|---|
| $51,036 | $50,978 | $49,467 | 0.10% | 3.20% |
| $63,501 | $63,145 | $63,120 | 0.60% | 0.60% |
| $88,726 | $88,804 | $87,473 | -0.10% | 1.40% |
| $59,094 | $60,291 | $56,286 | -2.00% | 5.00% |
| $35,744 | $36,068 | $33,732 | -0.90% | 6.0% |
| $39,780 | $39,652 | $39,090 | 0.30% | 1.80% |
| $35,196 | $35,057 | $35,380 | 0.40% | -0.50% |
| $35,881 | $36,176 | $34,643 | -0.80% | 3.60% |
Originally posted on Work Truck Online
More Used Vehicle Values
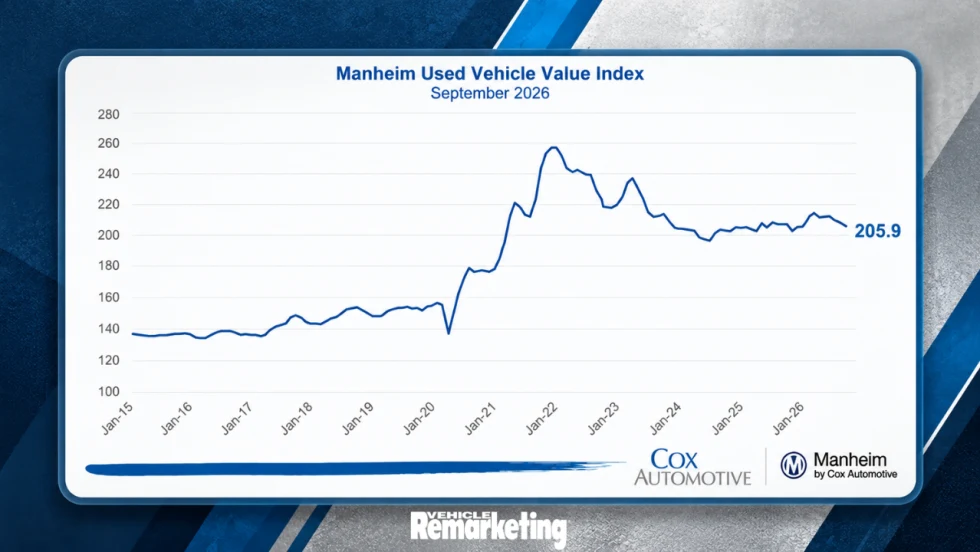
Wholesale Used-Vehicle Values Fall as Cox Automotive Cuts 2026 Forecast
Wholesale used-vehicle prices declined in September as depreciation accelerated, prompting Cox Automotive to lower its year-end forecast.
Read More →
Ford Pro Launches Certified Pre-Owned Program for Commercial Vehicles
Ford Pro Advantage will offer certified pre-owned Class 1-7 commercial vehicles through more than 700 Ford Pro Commercial Vehicle Centers.
Read More →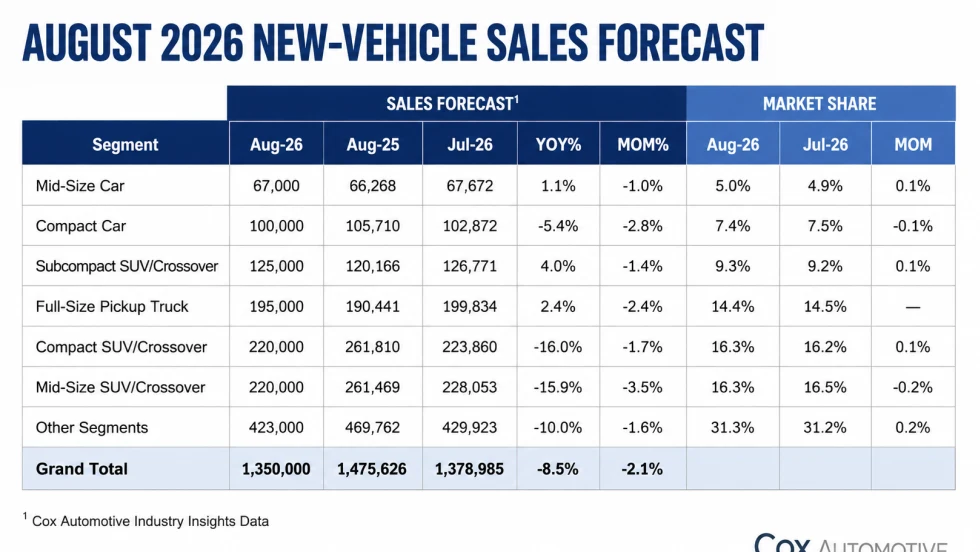
August New-Vehicle Sales Pace Forecast to Hold Above 16 Million
Despite an expected 8.5% year-over-year decline in August volume, Cox Automotive forecasts a 16.3 million SAAR, with full-size pickups outperforming several major crossover segments.
Read More →
Trade Strategy Now Starts Long Before Turn-In
The strongest trade values aren't built at turn-in. Discover how maintenance, lifecycle planning, and shared risk protect truck resale value.
Read More →
What Happens When Residual Values Meet Real-World Markets
A truck's trade value isn't determined on turn-in day. Learn how market cycles, maintenance, and timing shape the gap between residuals and reality.
Read More →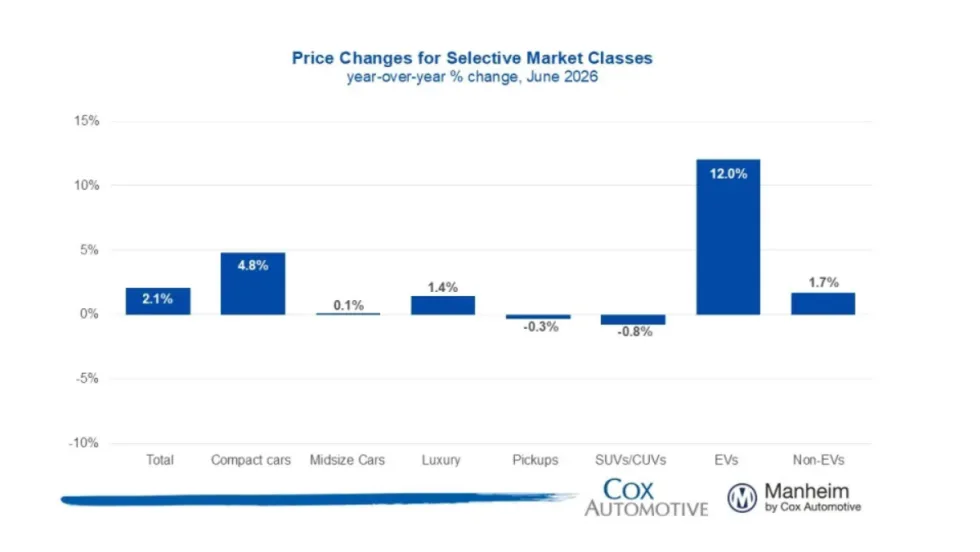
Manheim Index Shows Used-Vehicle Wholesale Prices Up 2.1% in June
The market is seeing stronger appreciation in older used vehicles this year, and the most affordable segments have been among the year’s best performers.
Read More →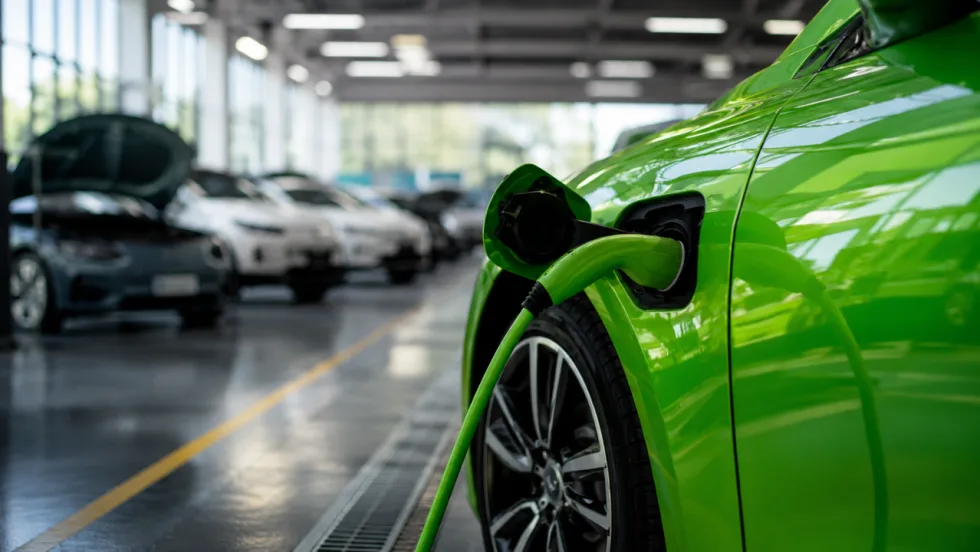
Stop Remarketing Electric Vehicles Like Gas Cars
The advantages and attributes of electric vehicles are upending the traditional remarketing cycle, requiring fleet sellers to rely on new factors and approaches detailed below.
Read More →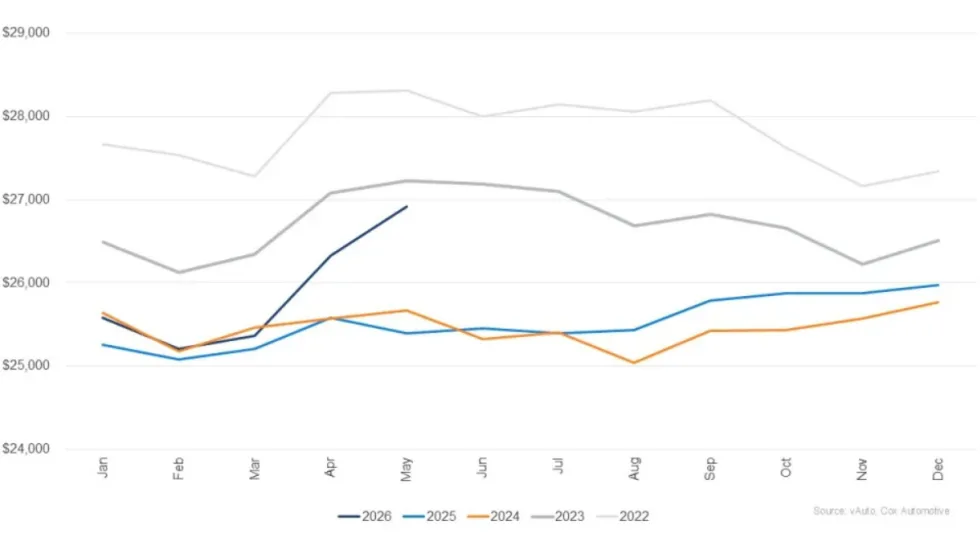
Used Vehicle Prices Climb Higher As Sales Pace Slows
The higher prices at used retail reflect strong wholesale values earlier in the spring, particularly for older, more affordable vehicles.
Read More →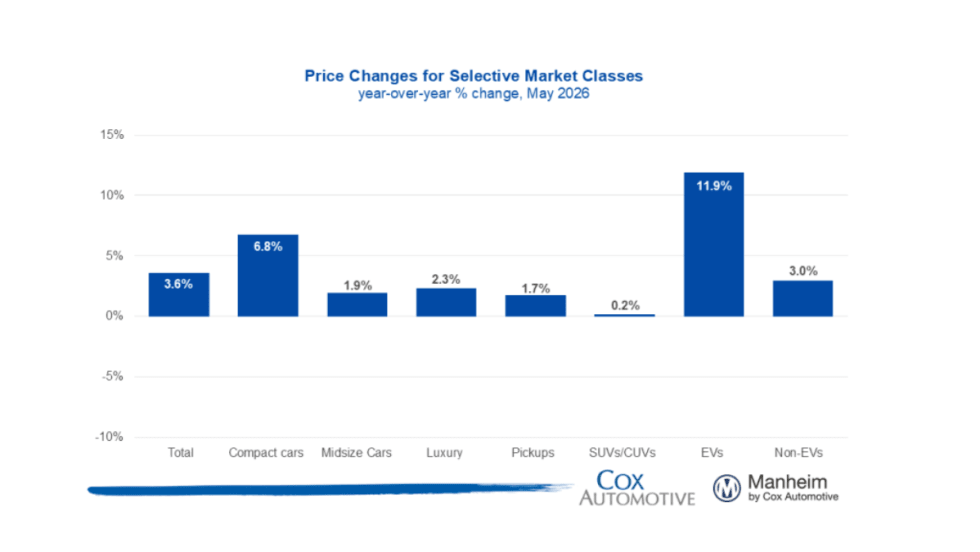
Wholesale Used Vehicle Market Sustains Moderate Rise In Values, Prices
Trends continue to normalize after a strong start to the year, as consumers contend with higher gas prices in the coming summer months.
Read More →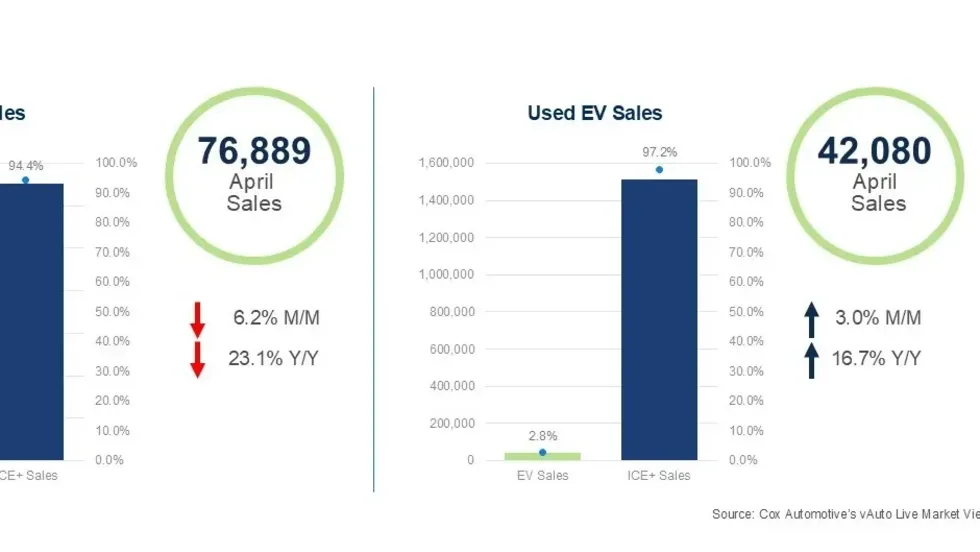
Used EV Sales Grow In April
While EV sales declined, used EV sales grew, as tighter inventory and rising prices reflected a more normalized pace for the EV market.
Read More →