



Average Cost of Incentives Climbs to New Record
Edmunds.com an online resource for automotive information, reported that the average manufacturer incentive per vehicle sold in the United States set a new record of $2,885 per vehicle sold in July 2004, up $217, or 8.1 percent, from July 2003, and up $138, or 5.0 percent, from June 2004.
Edmunds.com an online resource for automotive information, reported that the average manufacturer incentive per vehicle sold in the United States set a new record of $2,885 per vehicle sold in July 2004, up $217, or 8.1 percent, from July 2003, and up $138, or 5.0 percent, from June 2004.
Edmunds.com's monthly True Cost of Incentives (TCI) report takes into account all of the manufacturers' various United States incentives programs, including subvented interest rates and lease programs as well as cash rebates to consumers and dealers. To ensure accuracy, Edmunds.com bases its calculations on sales volume, including the mix of vehicle makes and models for each month, as well as on the proportion of vehicles for which each type of incentive was used.
Overall, combined incentives spending for domestic Chrysler, Ford, and General Motors nameplates passed the $4,000 mark for the first time, reaching $4,011 per unit in July, up $192 from June 2004. Chrysler lowered its incentives spending in July by $185 to $3,384 per vehicle and lost 2.3-percent market share. Ford had the biggest monthly increase in incentives spending, $358, for an average of $3,686 per vehicle, while its market share fell 1.3 percent to 16.8 percent – the lowest level ever recorded by Edmunds.com. GM increased incentives spending for the fourth month in a row, by $156 to $4,467 per vehicle, and gained 3.4 percent market share.
"Successful new model introductions like the Chrysler 300 – which made up 27 percent of the brand's sales in July – show the benefit of introducing exciting new products priced right for the marketplace," said Dr. Jane Liu, vice president of data analysis for Edmunds.com. "Both Ford and GM have new vehicles coming that should help them lower their incentives spending, at least at the beginning of the new model year."
In July 2004, Korean automakers spent $1,833 – down $35 – and European automakers spent a record $2,562 – up $228 – per vehicle sold. Japanese automakers spent $1,024 per vehicle sold in July, up from $921 the prior month.
"As evidenced by the record incentives spending by the European automakers in July, the incentives war is certainly not confined to the domestics," remarked Dr. Liu
Of all brands, Mini spent the least on incentives, $80, while Scion spent only $212 per vehicle and Porsche spent only $257. At the other end of the spectrum, Cadillac spent the most incentives dollars per vehicle for the fifth consecutive month, $7,878, followed by Lincoln at $5,480, and Jaguar at $5,248.
Among vehicle segments, large SUVs continued to offer the highest average incentives in July, $4,885 per vehicle. Other segments with high incentives were luxury cars at $4,306 and large cars at $3,663. Compact cars had the lowest average incentives at $1,662, followed by sports cars at $1,987, and luxury sport cars at $2,050.
Midsize SUVs have lost the most market share since July 2003, decreasing from 13.5 percent to 12.9 percent, while large SUVs have gained the most market share during that period, up from 5.0 percent to 6.4 percent of the U.S. new vehicle market.
"Although incentives don't always drive market share proportionally, it seems the great deals on large SUVs are hard for consumers to ignore," noted Dr. Liu.
More Operations
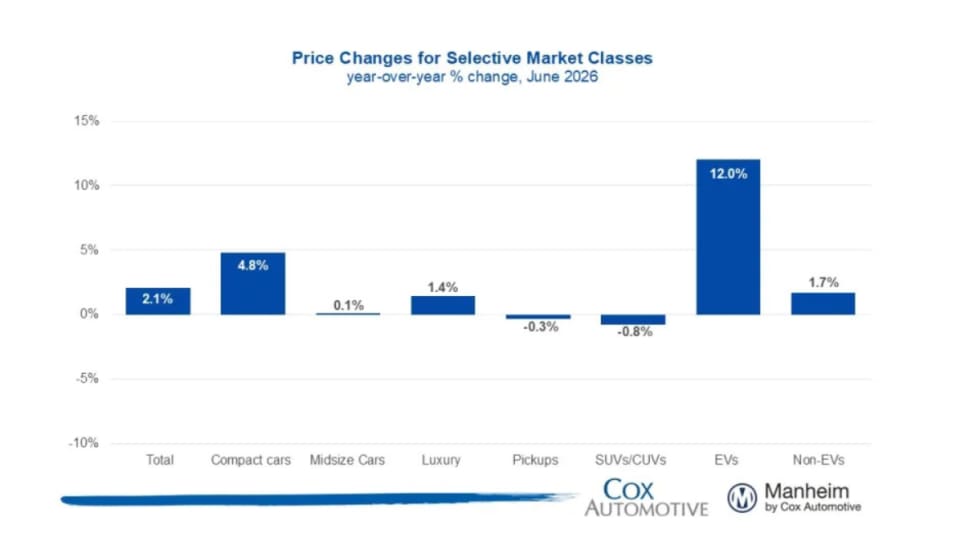
Manheim Index Shows Used-Vehicle Wholesale Prices Up 2.1% in June
The market is seeing stronger appreciation in older used vehicles this year, and the most affordable segments have been among the year’s best performers.
Read More →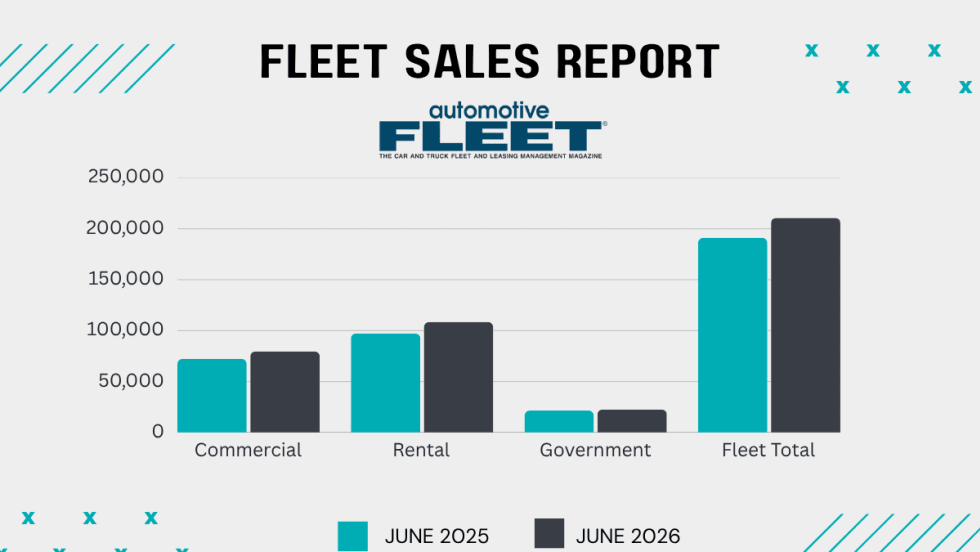
Commercial Fleet Sales Contribute To June, YTD Gains
The fleet sector has boosted its vehicle purchases at a reliable pace in the first half of this year compared with 1H 2025.
Read More →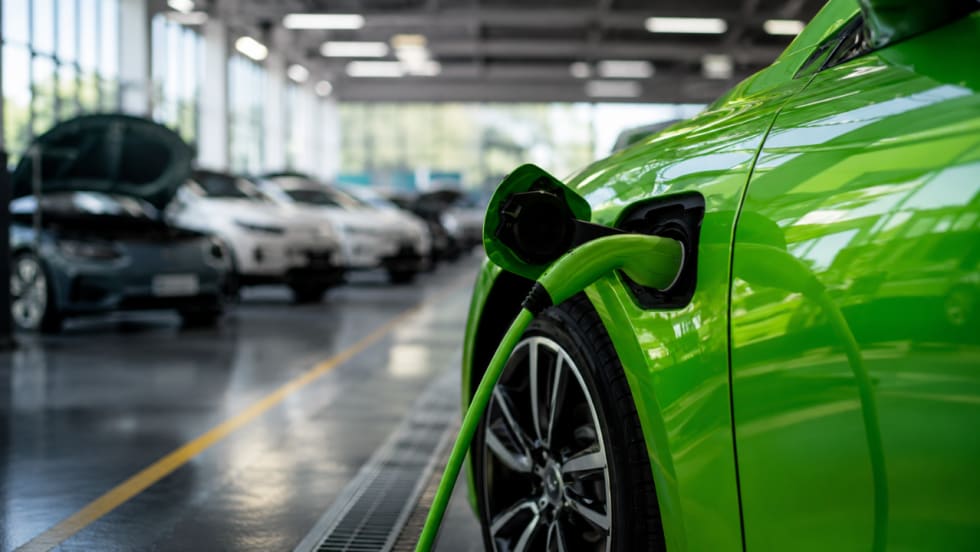
Stop Remarketing Electric Vehicles Like Gas Cars
The advantages and attributes of electric vehicles are upending the traditional remarketing cycle, requiring fleet sellers to rely on new factors and approaches detailed below.
Read More →
AP Fleet Management Expands Remarketing Program for Commercial Work Trucks
AP Fleet Management expanded its commercial vehicle remarketing program with dedicated resale services and an online marketplace for used work trucks.
Read More →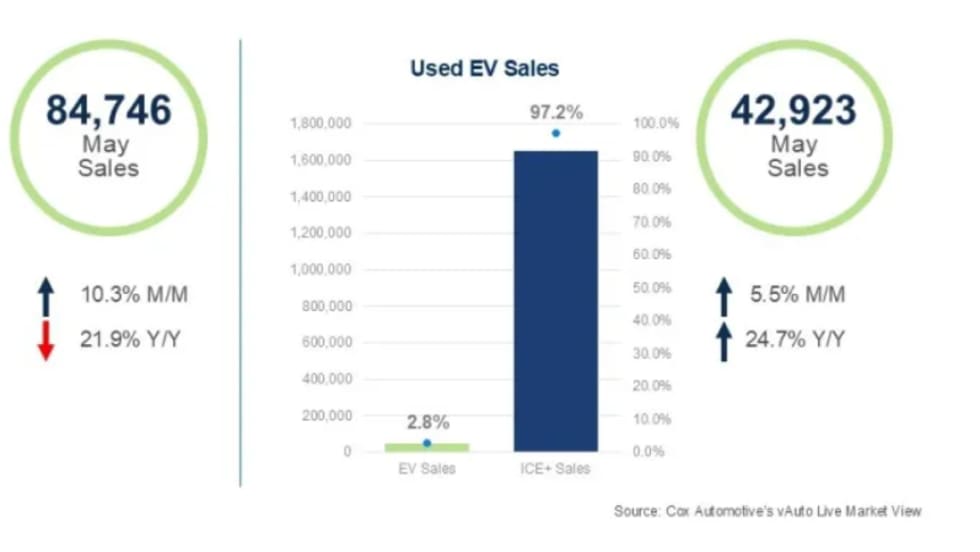
Used EVs Strengthen Overall Electric Vehicle Market
The latest sales data point to several reasons for the divergent trends in new and used EVs that can factor into fleet cycling decisions.
Read More →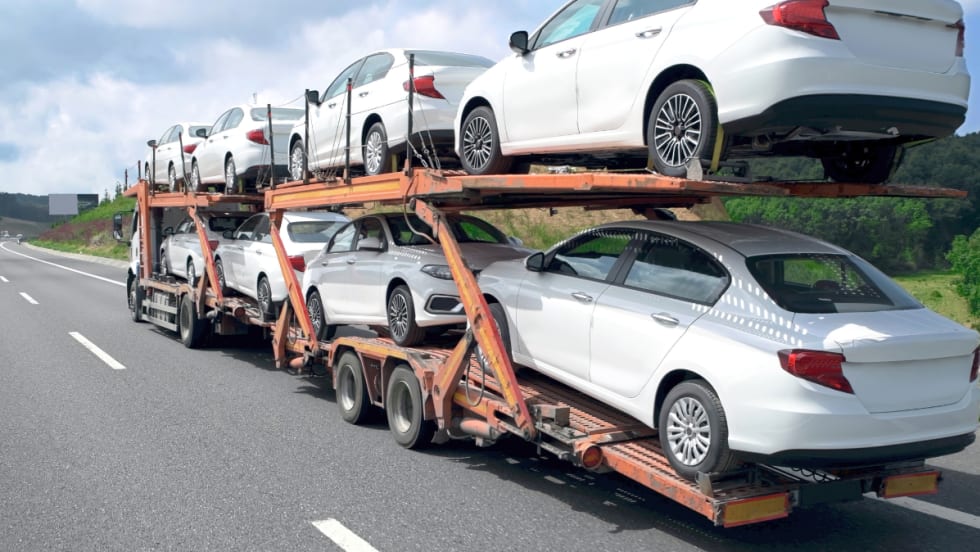
The Data-Driven Haul: 5 Ways AI is Leveling the Playing Field in Auto Transport
Large and small transport fleets are becoming more competitive as predictive analytics and real-time data inform the logistics decision chain.
Read More →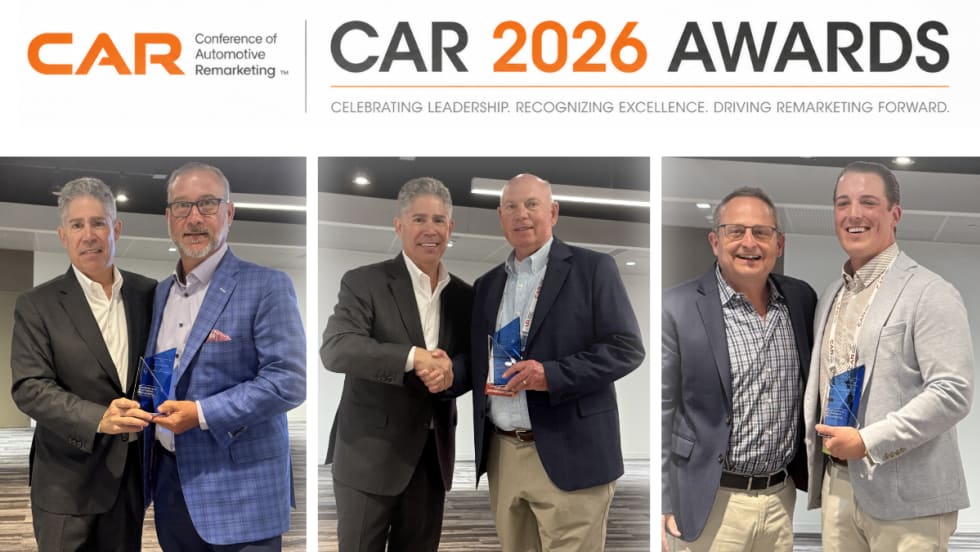
2026 CAR Awards Celebrate Industry Excellence
CAR’s annual Fleet Remarketing Awards opened a reimagined 2026 conference designed to bridge the worlds of fleet management and automotive remarketing.
Read More →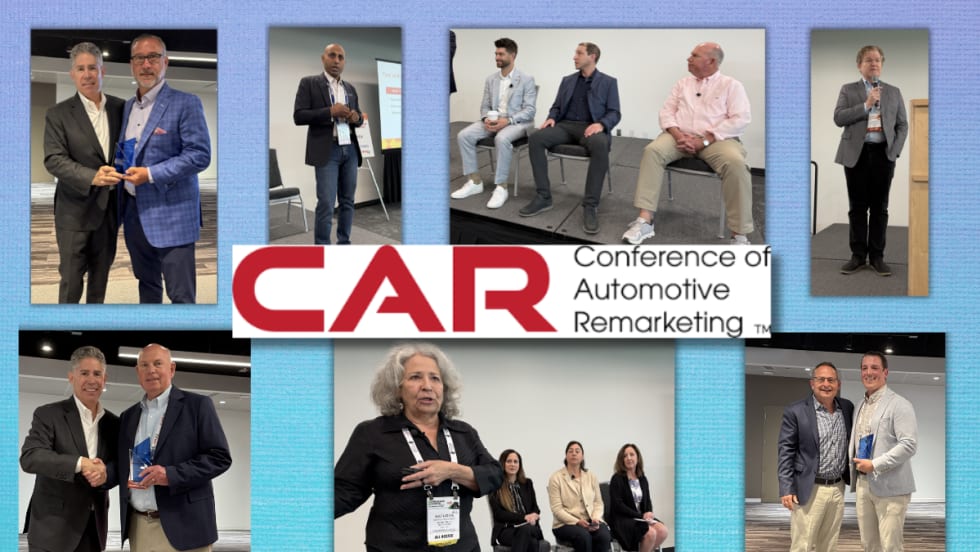
CAR 2026 Recap Part 2: Closing the Gap Between Data & Remarketing Value
The second half of CAR 2026 examined how fleets can translate lifecycle strategy, vehicle data, and market shifts into higher real-world results.
Read More →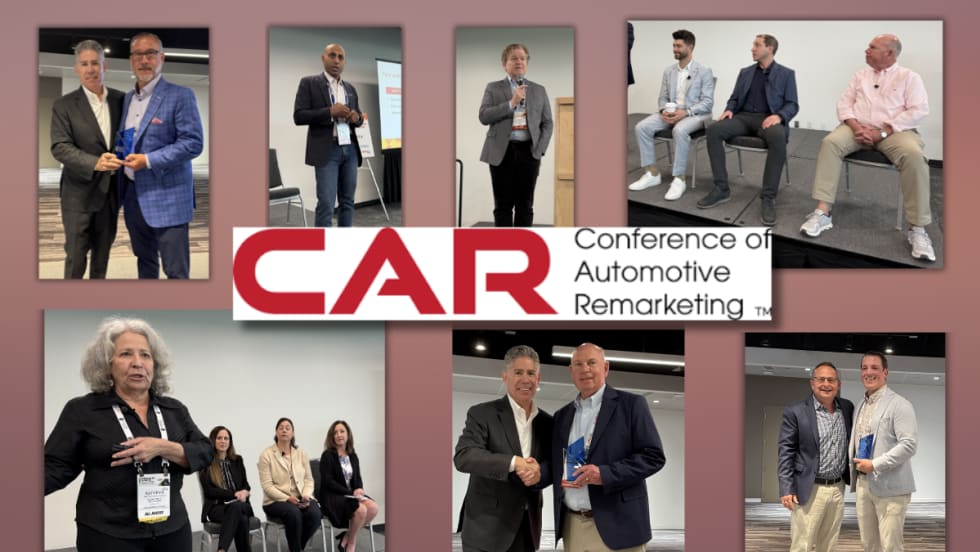
CAR2026 in Two Words: Velocity, Value (Part 1)
The 2026 Conference of Automotive Remarketing convened with a mandate to involve a new constituency — fleet managers — and an updated mission to demonstrate unrealized value in de-fleeted vehicles.
Read More →
CAR 2026: Get the Wall Street Update on the Key Players in Remarketing
From a Wall Street analyst's take on remarketing's key players to whether fleets need their own version of Carfax, CAR 2026's afternoon roundtables will answer key operational and industry questions.
Read More →