Vehicle depreciation is impacted by a number of factors, from supply and demand to overall economic conditions. While 2015 was relatively stable for depreciation, some challenges are on the road ahead.
Industry subject-matter experts agree on one thing: Overall, vehicle depreciation from 2014 to 2015 has remained relatively stable.
Despite struggling car segments, stronger truck, van, and SUV segments are helping keep trends stable year-over-year.
Ad Loading...
“The used-vehicle market remains strong overall this year, driven by truck segments. Passenger cars are experiencing twice the depreciation as that of trucks. Trucks, mostly pickups and large SUVs, have been in strong demand due to improvement in housing construction and low gasoline prices,” said Anil Goyal, VP, automotive valuation and analytics at Black Book.
AT A GLANCE
Depreciation trends from 2014 to 2015 have remained stable, with a few items of note:
● Overall, the used-vehicle market remains strong.
● Compact cars have experienced resale struggles.
● Light trucks experienced a decrease in overall depreciation.
● Small- and mid-size SUVs experienced a decrease in overall depreciation.
● Overall, the 2014 to 2015 calendar-year is showing signs of a fading economic recession.
But, compact cars have experienced resale struggles.
“Compact cars have been the weakest segment in terms of resale performance over the past year, with large SUVs and light trucks leading the way in retention certainly influenced by fuel price trends over 2015,” according to James Crocker, director of fleet operations for Merchants Fleet Management.
But, overall there wasn’t a drastic change in the pace of depreciation year-over-year.
“The pace of vehicle depreciation in 2015 was very close to that of 2014 for the overall market. Passenger cars (especially compact models) significantly under performed in the overall market, while wholesale pricing for light trucks and cargo vans was strong throughout the year,” according to Tom Webb, chief economist for Cox Automotive.
Ad Loading...
John Wuich, VP, strategic consulting services for Donlen, agreed. “Overall, using a weighted segment average and recent model-years, the rate of depreciation from 2014 to 2015 has slowed as compared with 2013 to 2014,” he said.
One reason for the difference is due to record-selling used-vehicle prices from 2013 to 2014.
“Overall, there has been a slight increase in the cents per mile for the cost of depreciation; however, 2013 and 2014 were record-selling prices and the vehicle model-years of vehicles selling during this period were in short supply. The supply was impacted by the reduced volume in new-car production in prior years. Nevertheless, the increase has been minimal compared to historical depreciation costs and clients still enjoyed good depreciation rates during 2015,” according to Bob Black, director, client analytics for Wheels Inc.
Another major factor in current and future trends is the price of gasoline.
“Depreciation trends, as reflected in wholesale auction prices, have tended to be negatively skewed toward car segments, while van, SUV, and pickup truck segments have tended to withstand the incoming volume of off-lease, off-rental, off-fleet, repo, and dealer supply without severe reduction in prices. This is likely to remain true going forward due to low gasoline prices,” according to Tom Kontos, executive vice president of customer strategies and analytics for ADESA.
Ad Loading...
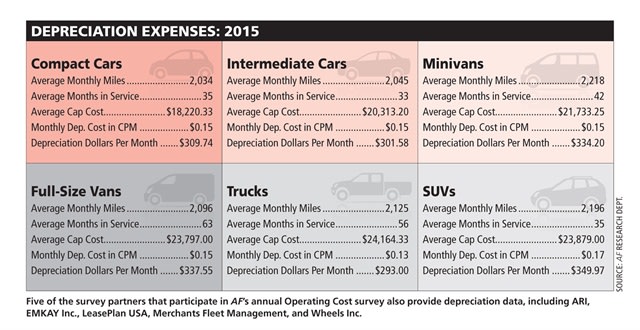
Depreciation expenses for 2015. Source: AF Research Dept.
Depreciation Trends by Vehicle Segment
While vehicle depreciation was stable overall, each vehicle segment tells a separate story. Digging deeper into each segment is key to seeing the full picture.
“For compact cars, both the average monthly miles and average months-in-service measurements have slowly crept up. In 2013, the average monthly miles measurement for the compact car segment was 2,017 miles; by 2015, the average monthly miles measurement for that same segment was 2,084 miles. Similarly, the average months-in-service for the compact car segment in 2013 was 36.3 months; by 2015, that had increased to 42.2 months,” according to Bob Graham, VP of vehicle remarketing at ARI.
And, the story for intermediate cars is somewhat similar, but with an interesting difference, according to Graham.
“While the months-in-service have gone up, and depreciation as measured by cost per mile has remained steady, the average number of monthly miles driven has dropped. In 2013, the average monthly miles measurement for intermediate cars was 2,158 miles; in 2014, it dropped 8.2 percent to 1,995 miles; and in 2015, it moved up slightly to 2,095 miles, but remained below the 2013 peak. Despite this fluctuation, average months-in-service increased from 34.1 months in 2013 to 38.1 months in 2015,” he said.
New standard equipment is also making an impact on stable resale values.
Ad Loading...
“The passenger car segment has enjoyed flat or small increases in costs. This is primarily due to the competitiveness of this segment. In addition to front-end pricing, the list of standard equipment continues to increase and the quality of products has improved resulting in vehicles that tend to retain their value,” said Black of Wheels Inc.
Auction supply levels also impacted car depreciation values.
“Depreciation costs increased for all segments, except light trucks, for 2015. This increase is primarily due to higher auction supply levels, which led to more competition in the lanes (from a consignor perspective). For 2015, consignors experienced slightly lower overall sale prices when compared to 2013 and 2014,” according to Becky Langmandel, director, strategic modeling and analytics research team for LeasePlan USA.
Trucks did well over the past year, generally performing better than average.
“Factors include lower national fuel prices, rollout delays for replacement models, and growth in certain industries utilizing this segment. Limited availability of compact pickups, both used and new, have further allowed this segment to perform above average,” said Wuich of Donlen.
Ad Loading...
According to Graham, average monthly miles took a very slight dip in 2014 for light-truck segments, but, for the most part, have remained almost exactly the same. “In 2013, the average monthly miles measurement for light trucks was 1,949 miles; in 2015, it was 1,946 miles. The average months-in-service has gone down slightly, from 62.4 months in 2013, to 60.7 months in 2015. The monthly depreciation as measured by cost per mile remained stable; it was 13 cents in 2013, and 12 cents in 2014 and 2015,” he said.
Supply and demand is also a factor in light-truck depreciation.
“The light-truck segment continues to have lower depreciation costs during the past three years for a number of reasons, including lower supply, increased demand due to shifts in consumer’s tastes, lower fuel costs, and improved economic conditions,” Black said.
Fuel prices and other economic factors have been creating demand, including an increase in new-home construction in the U.S., and depreciation for light trucks and cargo vans has been relatively unchanged when compared to 2013 and 2014, according to Langmandel.
Small and mid-size SUVs also experienced lower depreciation over the past year. “While depreciation has increased year-over-year for many smaller, more fuel-efficient vehicles, it has held steady for small and mid-size SUVs,” Langmandel said.
Ad Loading...
Reviewing the minivan segment, mileage has decreased while months-in-service has increased.
“Average monthly miles for minivans has consistently decreased year-over-year, from 2,248 miles in 2013 to 2,112 miles in 2015. The average months-in-service measurement, however, has remained relatively steady. In 2013, the average months-in-service for the minivan segment was 44.1 months while in 2015 it was 45.9 months,” Graham said.
And, finally, full-size vans have also experienced stable average monthly miles.
“In 2013, the average monthly miles measurement for full-size vans was 2,079 miles, while in 2015 it was 2,055 miles. The average months-in-service measurement, however, has increased quite a bit. In 2013, the average months-in-service for the full-size van segment was 58.3 months; in 2014, it went up to 65.9 months, and in 2015 it was up to 70.6 months. Similar to every other segment, though, the monthly depreciation as measured by cost per mile has remained stable,” Graham continued.
Overall, according to Black, the van segment, whether minivans or full-size vans, continues to be strong in resale.
Ad Loading...
“Minivans are still the No. 1 choice as a ‘people mover’ and the reduced supply during the last few years has caused their costs to remain flat. The full-size van market has been fairly strong due to the lack of supply of the traditional cargo vans and the transition from the traditional cargo to the more European styled vans. Combined with shifts in supply, the improved economy has caused prices to increase for this segment,” Black said.
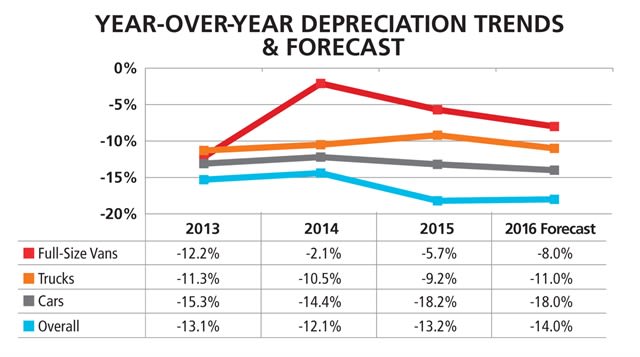
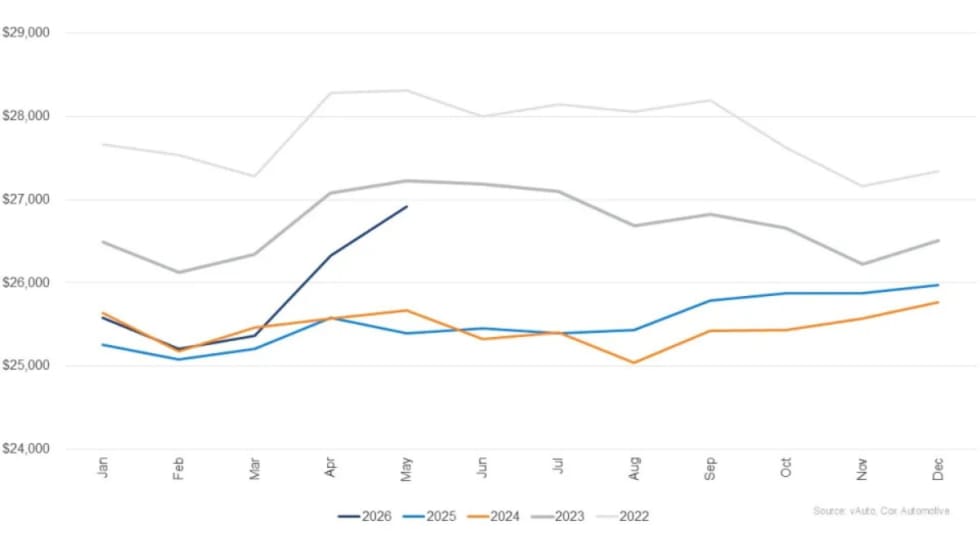
Depreciation trends and forecast on a year-over-year basis. Source: Black Book USA
Depreciation’s Impact on Replacement Cycling Parameters
Evaluating vehicle cycling and cycling policies continues to be a focus to optimize net depreciation, according to Crocker of Merchants Fleet Management. “Leveraging lifecycle cost models allows fleet managers to model multiple scenarios and find the ‘sweet spot’ between order volumes affecting CPA monies, net depreciation, as well as maintenance and fuel costs, with fleet managers validating or augmenting cycling policies through a data-driven approach,” he said.
But, 2014-2015 may show signs that the impact of the 2008-2009 economic recession is finally starting to fade.
“The data shows the effects of the recession are truly fading and fleets are again, for the most part, entering into normal replacement cycling patterns leading to more normalized and predictable depreciation rates. There was a period during the recession where fleets were holding onto vehicles for longer periods of time, causing the used-vehicle market to heat up because of a lack of inventory and resulting in increased depreciation values. As the economy has become stronger, companies have returned to more normal patterns of buying and selling of vehicles and equipment, and this has stabilized depreciation values,” said Graham of ARI.
However, some vehicle segments are still feeling an impact.
Ad Loading...
“Replacement cycles have declined for the more in-demand and higher-resale value segments in 2015. In a ‘normal’ market, when replacement cycles decrease, the depreciation costs per mile usually increase; however, due to the strong demand for light trucks, the shorter cycles did not affect depreciation costs, which remained unchanged year-over-year for this segment,” said Langmandel of LeasePlan, USA.
The opposite has held true for compact and mid-size cars.
“A slight shift in cycling upward to the next-largest segment has worked to weaken demand for compact and mid-size cars. In addition, replacement cycling of vans was slower than expected, allowing older vans to better retain value,” said Wuich of Donlen.
Understanding depreciation and its effect on fleet, and balancing it with corporate culture is one best practice.
“Fleets are now taking into consideration their effective depreciation rates when determining a strategic depreciation rate for a new or replacement vehicle. The monitoring of the wholesale market along with historical remarketing performance have greatly influenced fleet’s cycling behaviors. Furthermore, corporate culture, practice, and business needs are being taken into consideration as well. Best practices have always shown that it is ideal to, at the very least, break even at the end of the lease or to experience a gain on sale, which can then be allocated to new vehicle lease payments,” according to Mark Donahue, manager, fleet analytics and corporate communications at EMKAY.
Ad Loading...
But, vehicle cycling is not only impacted by vehicle depreciation, additional factors play an important part.
“Early cycling was not driven by depreciation alone versus other business needs such as total costs, business use, and driver satisfaction,” Black said.
The Strength of the Overall Resale Market
Overall, the resale market can be described currently as stable (and in some areas up), healthy, robust, and positive. But, will it last?
“New-vehicle sales continue to exceed expectations with the seasonally adjusted annual rate for October more than 18 million, up 14 percent year-to-date. The wholesale resale market remains stable year-over-year, with the volume of used-vehicle transactions keeping up with the increase in new vehicle sales. Wholesale market sale volume through October is up 4 percent year-over-year at 3.52 million sales. The OEMs are beginning to increase incentives to help move inventory, although not yet to unhealthy levels seen historically,” said Crocker of Merchants Fleet Management.
The positive resale market is also currently slowing some depreciation rates.
Ad Loading...
“The strength of the retail used-vehicle market — driven by favorable labor market and credit conditions — has been the primary supporter of strong wholesale values, and, thus, slower depreciation in 2015,” said Webb of Cox Automotive.
But, this isn’t the case for all vehicle segments.
“The pickup and van segments remain dominant in the resale market while outperforming all other segments; resale values are up year-over-year in both segments. Slowed demand in the car markets have meant lower resale values for both the mid-size and compact segments, the latter in particular,” said Wuich of Donlen.
But, overall the stability in vehicle depreciation has allowed for some fleets budget more strategically.
“As a whole, EMKAY’s remarketing trends show that significant gains/losses on sales have become less prevalent from 2013 to 2015. This has allowed for fleets to more strategically budget their monthly operating costs. We also have some fleets that prefer to implement a higher depreciation rate to capitalize on market conditions, which, in turn, will render a higher gain on resale. This positive equity position is then essentially reinvested back into the fleet to offset new vehicle operating costs,” said Donahue of EMKAY.
Ad Loading...
In the end, the resale market remains steady, but robust, according to Graham of ARI.
“While fleets are becoming increasingly comfortable returning to more normal (and shorter) replacement cycles, the continued growth in the U.S. economy — especially in construction — combined with low gasoline prices and the new models with updated technology being introduced into the market has led to increased demand. Depreciation has remained steady, but it is not clear if that will last,” Graham said.
Short- & Long-Term Depreciation Forecasts
Looking at depreciation forecasts for the near-term, there may be some challenges ahead.
“As the economic demand matures and used supply increases across most segments, we expect the depreciation levels to worsen from the strong depreciation seen in the past four years. But, 2016 depreciation levels are expected to still be better than the pre-recession range at 16- to 18-percent depreciation. Trucks are expected to continue to perform better than cars,” said Goyal of Black Book.
Vehicle cycling will also have an impact on near-term depreciation.
Ad Loading...
“Some fleets haven chosen to cycle more quickly than before, SUVs and trucks in particular, due to strength of the resale market and newer technology offered. As a result, more used vehicles are becoming available. The near-term impact may be to slow or reverse recent increase in resale value,” said Wuich of Donlen.
However, Webb of Cox has a more optimistic outlook. “We expect the pace of vehicle depreciation will accelerate back to more normal levels in the years ahead as wholesale supplies grow as a result of larger off-lease volumes. Related, pricing will likely be weakest for those models that had a high volume of heavily subvented leases originations in the past few years,” he said.
But, according to Crocker of Merchants Fleet Management, “The OEMs are building more cars than ever. The question is, if the SAAR levels or declines into 2016, how will the OEMs respond with incentives to move additional volume, and how long until the wholesale market ceases to keep up with the increased supply, and prices erode?”
Looking long-term, vehicle supply and demand will be one factor to consider.
“Future used-vehicle pricing is driven by supply and demand, so it makes sense to examine these two variables separately when forecasting future secondary-market and depreciation levels,” said Paul Fortin, economist and VP of Strategic Modeling and Analytics at LeasePlan. “Demand is dependent on both economic and industry factors that have been generally favorable in 2015. The supply side of the equation, while complicated by changes to funding type and term mix, is based on the fact that new-vehicle sales drive future used-vehicle supply. Since new-vehicle sales have increased substantially over the past few years — from more than 10 million SAAR in 2010 to more than 17 million SAAR in 2015 — the growth in used-vehicle supply will continue to put pricing pressure on future secondary market values.”
Ad Loading...
The impact of increased supply is forecast to continue to impact overall depreciation.
“We forecast a modest increase in depreciation costs over the next few years due to the record supply of returns anticipated in calendar years 2016 through 2018. The increase in supply will be primarily from off-lease and rental car returns. This trend is very similar to the record supply we encountered in the early 2000s,” said Black of Wheels Inc. “At that time, it resulted in lower selling prices; however, there is a big difference this time: The remarketing industry is better poised to handle the increased supply with better technology, for both the buyer and the seller, which results in market efficiencies and a larger geographic footprint. In addition, an anticipated increase in new vehicles costs associated with the new CAFE standards in model-year 2017 will likely impact used values. As in the past, higher new vehicle costs can pull used-vehicle values higher in the auction lanes.”
But, the long-term forecasts could be good for pickup trucks.
“In general, larger vehicles will continue to outperform the compact car segment in the resale market as fuel prices continue to remain low. The pickup truck segment will further benefit from continued demand created with growth in construction markets,” Wuich said.
Thus, long-term, used-vehicle values may see a decline.
Ad Loading...
“It is reasonable to assume that this supply shift will result in a moderate (low-single digit percent) annual decline in used-vehicle values over the foreseeable future. If economic or industry factors drastically change, it is reasonable to expect that the pricing deterioration will be more severe,” Fortin said.
Graham of ARI, however, is seeing some positive potentials.
“Overall, I think it is hard to say, but continued economic growth combined with an interest in new technology and newer models across every segment could lead to upward pressure on depreciation values. We have seen some bumps along the way as the economy has recovered — for example, the oil and gas sector has had to adjust as oil prices have dropped, and this has affected vehicle orders. Uncertainty across the globe is another wild card that could affect how our own economy performs. But, for the most part, I think prices will remain stable with the potential for growth in depreciation values if the economy remains strong,” Graham said.
Also noting economic factors is Black: “The biggest unknown is the future of interest rates. For several years, low interest rates drove new- and used-vehicle loans to consumers and floor planning loans to dealers. New technology, combined with a good economic environment, contribute to good performance in both new- and used-vehicle markets,” he said.
In the end, Donahue of EMKAY cautioned fleet managers to remain vigilant, ensure frequent discussions, and never make assumptions.
Ad Loading...
“Blanket assumptions for depreciation levels for an entire fleet never should have been considered a ‘best practice.’ Fleet managers must handle depreciation levels on a vehicle-by-vehicle basis as driver, utilization, cycling policy, etc., vary across the board. We predict strategic discussions circling around depreciation levels will become the norm in the fleet arena,” Donahue said
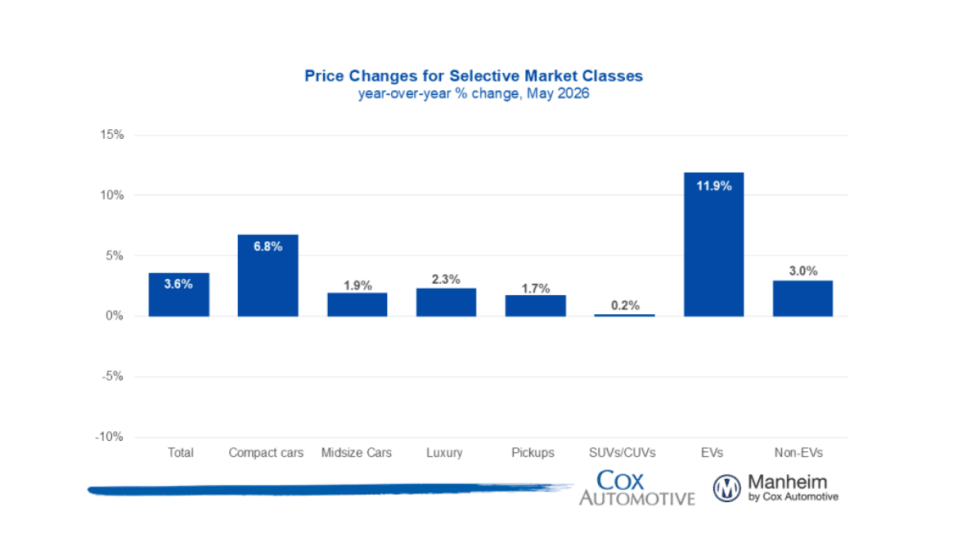
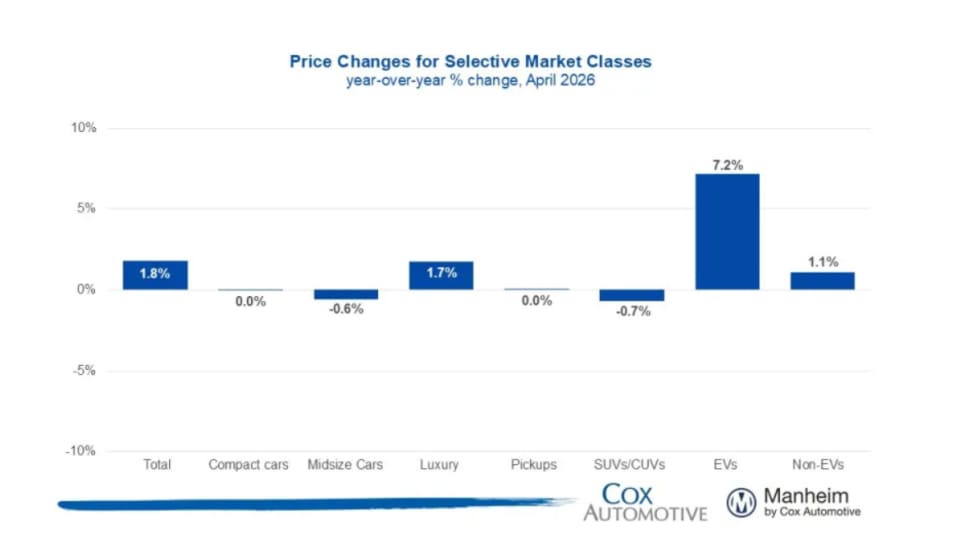
The market is seeing stronger appreciation in older used vehicles this year, and the most affordable segments have been among the year’s best performers.
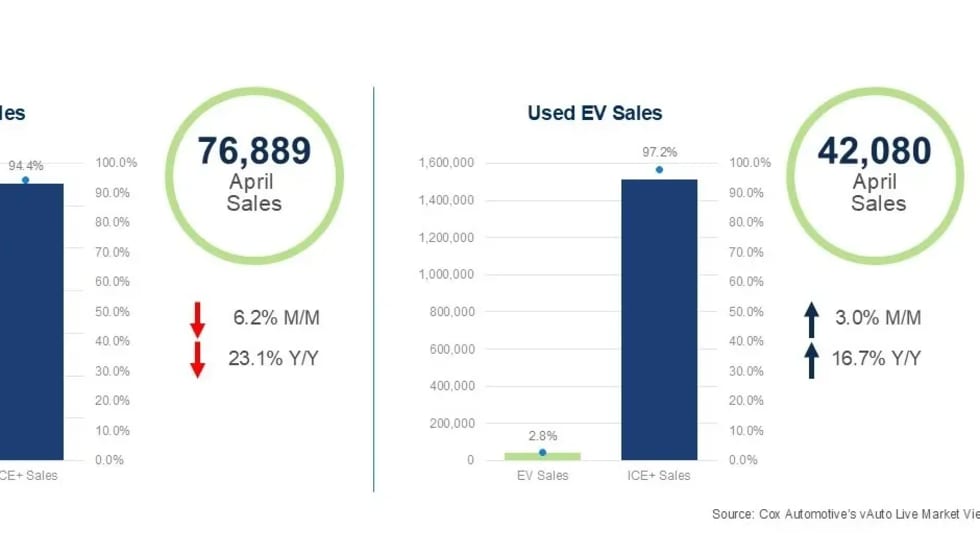
The advantages and attributes of electric vehicles are upending the traditional remarketing cycle, requiring fleet sellers to rely on new factors and approaches detailed below.
The Iranian conflict and rising gas prices inject much uncertainty into the future wholesale used vehicle markets, as higher gas prices soak up spendable income from vehicle buyers.
The 2026 Conference of Automotive Remarketing convened with a mandate to involve a new constituency — fleet managers — and an updated mission to demonstrate unrealized value in de-fleeted vehicles.