

More News: Used Vehicle Prices, Sales, and Inventory Up in 2025
November Wholesale Used Prices Suggest Market Gains Ahead
While consumer sentiment remains subdued, early reads suggest confidence is recovering amid good vehicle sales supported by lower APR rates.
December 8, 2025
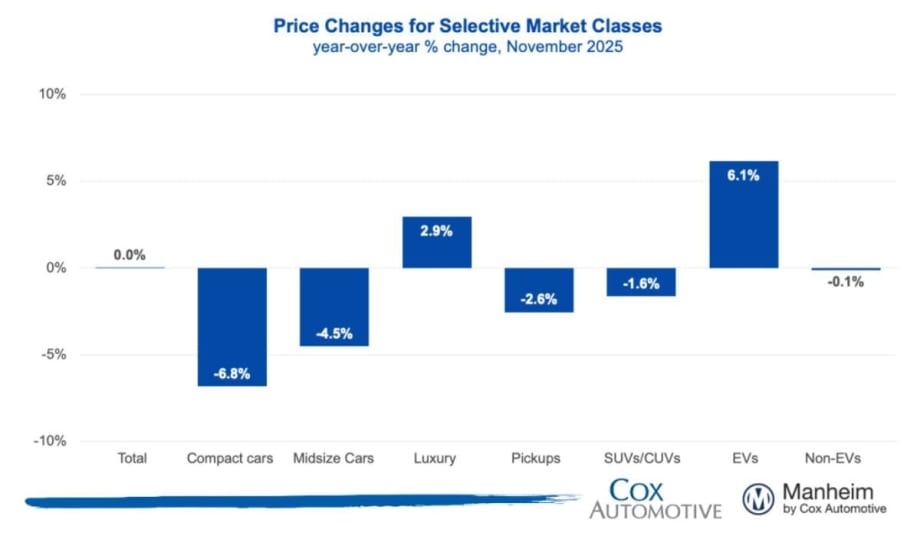
Overall market prices were flat year over year, with luxury vehicles posting the largest increase and compact cars recording the largest decline.
Graphic: Cox Automotive
3 min to read
The Manheim Used Vehicle Value Index (MUVVI) rose to 205.4, reflecting a 1.3% increase in November’s wholesale used-vehicle prices (adjusted for mix, mileage, and seasonality) compared to October.
The index is mostly unchanged from November 2024. The long-term average monthly move for November is a decrease of 0.6%.
Non-adjusted wholesale vehicle prices fell 0.3% from October and are now flat year over year, giving back some of the strength observed throughout most of this year. The long-term average monthly move in non-adjusted values is a decline of 0.4% in November.
“Like most metrics we track across the automotive landscape, wholesale prices dipped in October before showing modest improvement in November," said Jeremy Robb, chief economist for Cox Automotive, in a Dec. 8 news release. “As November progressed, both new and used retail sales lifted from October levels, and the longest government shutdown in history ended.
"While consumer sentiment remains subdued, early reads suggest confidence is recovering. We’re seeing good vehicle sales supported by lower APR rates, and price depreciation is trending back to normal, with values slightly higher than usual. We’re also only a month from January, when lower tax withholding rates will boost take-home pay. Once consumers feel that in their paychecks and realize their tax refunds could be substantially higher this year, we are expecting some tailwinds to hit the auto market.”
MMR Prices, Retention, and Sales Conversion
MMR prices declined slightly more than the typical 1.7% for this period, but the trend eased as the month progressed. Although MMR retention decreased somewhat, it remains generally in line with expectations for this time of year.
Meanwhile, sales conversion indicates a modest strengthening of demand, with conversions higher than usual for this time of year.
MMR prices for the Three-Year-Old Index declined 1.9% in November.
MMR retention averaged 98.9% in November, down 0.1 percentage points from October and 50 basis points year over year.
Sales conversion was 57.2% for the period, up 2.9 percentage points from October and 5.2 percentage points higher than the most recent three-year average.
YOY Price Changes In Vehicle Segments
Overall market prices were flat year over year, with luxury vehicles posting the largest increase and compact cars recording the largest decline.
Most vehicle segments remain lower against last year; however, we continue to see the luxury segment outperforming the overall market. We have observed the strength in this segment for several months, as it is more influenced by higher EV prices. Compact and midsize cars continue to see large declines compared to last year.
EV versus Non-EV Index
With the expiration of government-backed EV incentives, market pricing dynamics shifted. Essentially, the retail prices of many new and used EVs rose when incentives and the “leasing loophole” were removed, forcing dealers to offer lower prices to maintain demand.
EVs: The Electric Vehicle (EV) Index was up 2.3% from October (post EV tax credit expiration), and up 6.1% year over year.
Non-EVs: The Non-EV Index was up 1.3% from October and down 0.1% year over year.
Wholesale Supply And Rental Prices
Before the pandemic, wholesale used-vehicle supply averaged 32 days at the end of November, typically rising into year-end as seasonal factors played out. This year, wholesale supply rose over the month, as is usual, while holiday periods slowed the pace of sales.
Wholesale supply: At the end of November, wholesale days’ supply rose to 30.1 days, higher by 2.2 days compared to October, and higher by 1.3 days year over year
Rental prices: Prices for rental vehicles declined in November, falling by 4.3% from October. Non-seasonally adjusted values for Rental units are down 3.3% year over year, while average mileage is down 9.1% year over year.
Topics:ConversionElectric VehiclesUsed Vehicle PricesManheim IndexWholesale ValuesFleet RemarketingUsed Vehicle ValuesFleet
Originally posted on Automotive Fleet
More Used Vehicle Values

What Happens When Residual Values Meet Real-World Markets
A truck's trade value isn't determined on turn-in day. Learn how market cycles, maintenance, and timing shape the gap between residuals and reality.
Read More →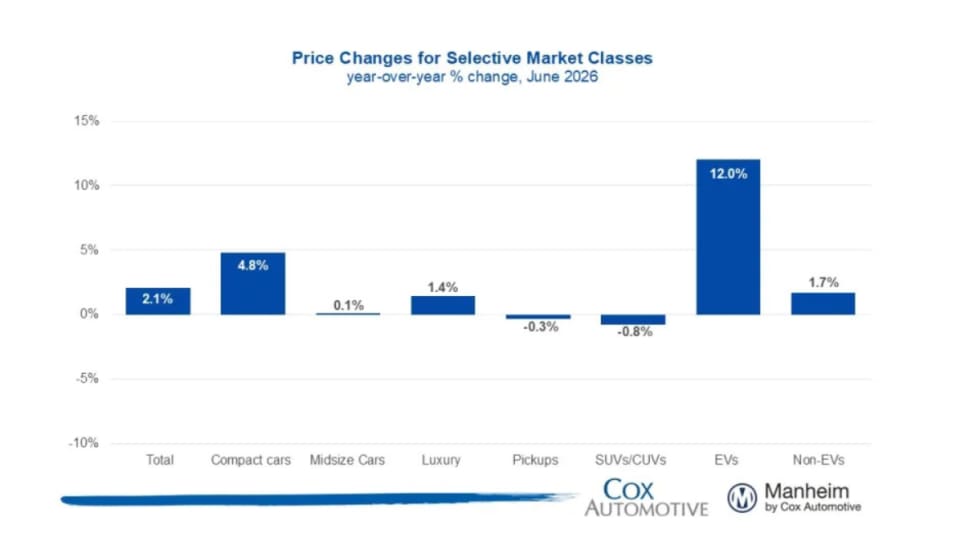
Manheim Index Shows Used-Vehicle Wholesale Prices Up 2.1% in June
The market is seeing stronger appreciation in older used vehicles this year, and the most affordable segments have been among the year’s best performers.
Read More →
Stop Remarketing Electric Vehicles Like Gas Cars
The advantages and attributes of electric vehicles are upending the traditional remarketing cycle, requiring fleet sellers to rely on new factors and approaches detailed below.
Read More →
Used Vehicle Prices Climb Higher As Sales Pace Slows
The higher prices at used retail reflect strong wholesale values earlier in the spring, particularly for older, more affordable vehicles.
Read More →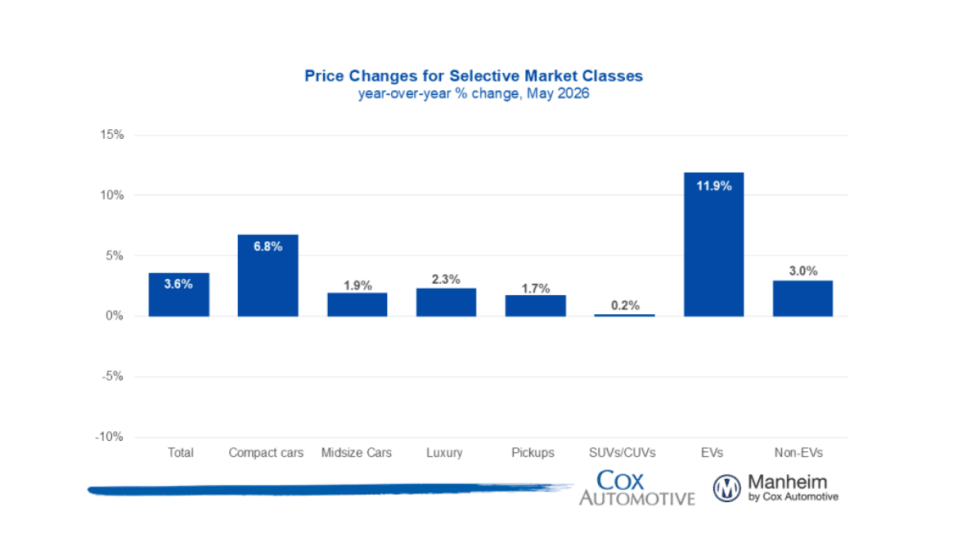
Wholesale Used Vehicle Market Sustains Moderate Rise In Values, Prices
Trends continue to normalize after a strong start to the year, as consumers contend with higher gas prices in the coming summer months.
Read More →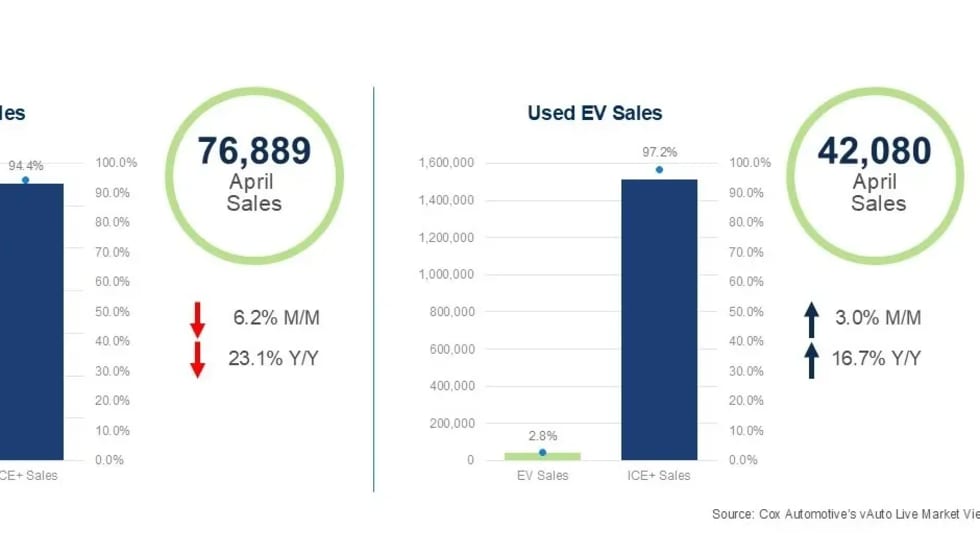
Used EV Sales Grow In April
While EV sales declined, used EV sales grew, as tighter inventory and rising prices reflected a more normalized pace for the EV market.
Read More →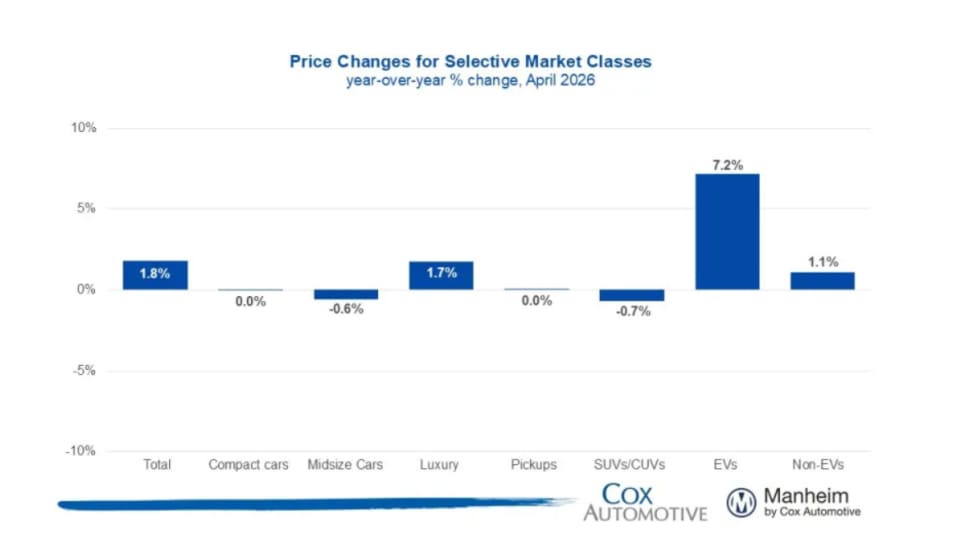
Wholesale Used Vehicle Prices Slightly Up In April
The Iranian conflict and rising gas prices inject much uncertainty into the future wholesale used vehicle markets, as higher gas prices soak up spendable income from vehicle buyers.
Read More →
CAR 2026 Recap Part 2: Closing the Gap Between Data & Remarketing Value
The second half of CAR 2026 examined how fleets can translate lifecycle strategy, vehicle data, and market shifts into higher real-world results.
Read More →
CAR2026 in Two Words: Velocity, Value (Part 1)
The 2026 Conference of Automotive Remarketing convened with a mandate to involve a new constituency — fleet managers — and an updated mission to demonstrate unrealized value in de-fleeted vehicles.
Read More →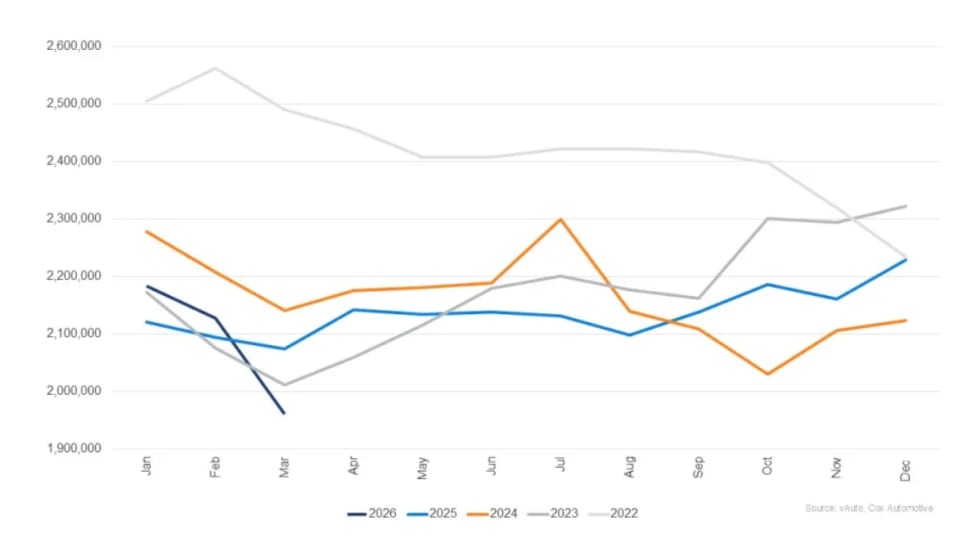
March Used Vehicle Inventory Falls To Lowest Since 2019
Franchised and independent dealers had a total of 1.95 million used vehicles in stock in March, the lowest on record in the current data set.
Read More →