



NADA Chief Economist Counters Edmunds.com Analysis of C4C Program
MCLEAN, VA – After a thorough review of the Cash for Clunkers program, the chief economist of the National Automobile Dealers Association (NADA), Paul Taylor, determined the cost of each incremental vehicle sold was around $4,587.
MCLEAN, VA – After a thorough review of the Cash for Clunkers program, the chief economist of the National Automobile Dealers Association (NADA), Paul Taylor, determined the cost of each incremental vehicle sold was around $4,587. An incremental sale is a sale that would not otherwise have occurred without the Clunkers program.
His findings bring into serious question the methodology behind the $24,000 estimate promoted last week by the car-buying Web site Edmunds.com.
“It’s really not that hard to determine a credible cost estimate for the Clunkers program,” says Taylor. “You subtract projected sales versus actual sales for July and August when the Clunkers program was operating, and divide the program’s $3 billion by that number.”
Taylor says that, based on sales volume for previous months, a realistic projection of auto sales for July and August would be around 1.6 million. Actual sales for those two months totaled 2,253,963. The difference is 653,963. That’s the number of incremental sales generated by the Clunkers program. Divide the program’s $3 billion by that number and you get $4,587, the average cost per incremental Clunker sale.
Taylor says the methodology used by Edmunds.com in its analysis of the Cash for Clunkers program is “fundamentally flawed.”
“The analysis by Edmunds.com is wrong on the two main points that it tries to make. First, because of is flawed methodology, the study can’t form the basis for measuring the program’s impact or costs. Secondly, and more importantly, the analysis clouds understanding and misleads rather than clarifies the true state of auto sales and the economy,” Taylor added.
Edmunds.com says it came up with its estimates by examining the sales trend for luxury vehicles and others not in Cash for Clunkers, and applying the historic relationship of those vehicles to total SAAR (Seasonally Adjusted Annual Rate). Taylor says this method virtually assured that cost estimates would be “overstated and inflated.”
“Historically, over the past 20 years, auto sales have been lower in July and August than in June, in the absence of strong incentives. Edmunds ignores this,” says Taylor.
“The Dow Jones and broader market indexes made strong recoveries over the summer, assisting luxury light vehicle sales. But there is a fundamental difference between what drives luxury car sales and non-luxury sales,” says Taylor. “An improving stock market, for example, may boost luxury car sales but it has little effect on non-luxury sales. Job growth, income growth and housing affect non-luxury vehicle sales. And in each of those categories the numbers are not good. Unemployment is up. Income is down. And housing prices continued to fall through July. This has not been the kind of economic environment that encourages a purchase by the average car buyer.”
Taylor says that Edmunds.com also painted a too-rosy picture for auto sales for the rest of the year. He points out that the Conference Board’s Consumer Confidence Index actually dropped to 47.7 in October from 53.4 in September. “This does not support a dramatic increase in non-luxury car sales for the final months of 2009, as suggested by the estimates in the Edmunds.com analysis,” says Taylor.
“Edmunds.com has obviously underestimated just how much the Clunkers program stimulated car sales,” says Taylor. “The Clunkers program lit up the market. Auto showrooms went from almost empty to overflowing. It’s hard to imagine how anyone who takes an objective look at the Cash for Clunkers program can reach any conclusion other than it gave a dramatic boost to retail sales and manufacturing output.”
More Operations
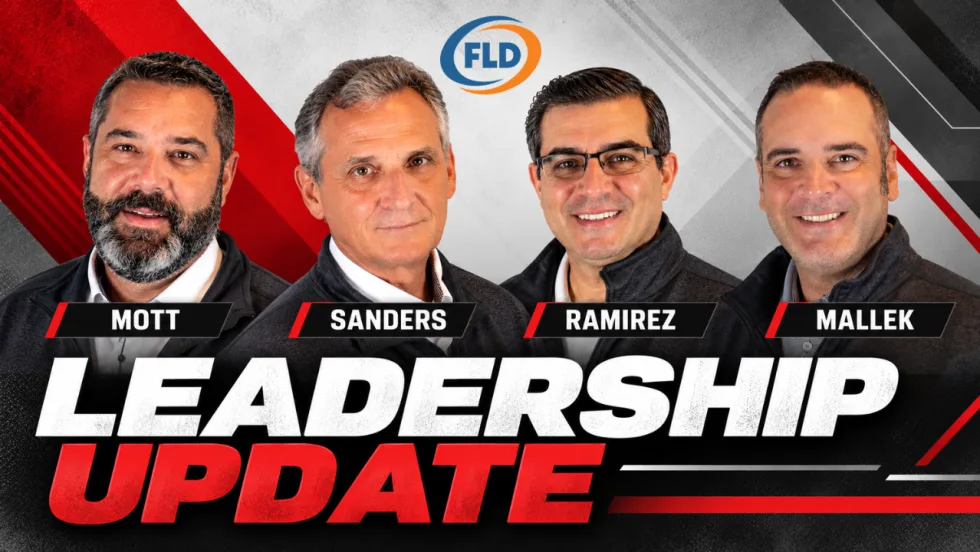
FLD Promotes Three Executives in Leadership Changes
FLD has promoted three longtime executives, naming Gary Mott CEO, Richard Mallek president, and Ron Sanders managing partner.
Read More →
CAS Automotive Launches Remarketing Service for Damaged, Surplus Equipment
Damaged Equipment expands CAS Automotive’s vehicle remarketing model to commercial equipment, targeting fleet operators, insurers, equipment dealers, and rental companies.
Read More →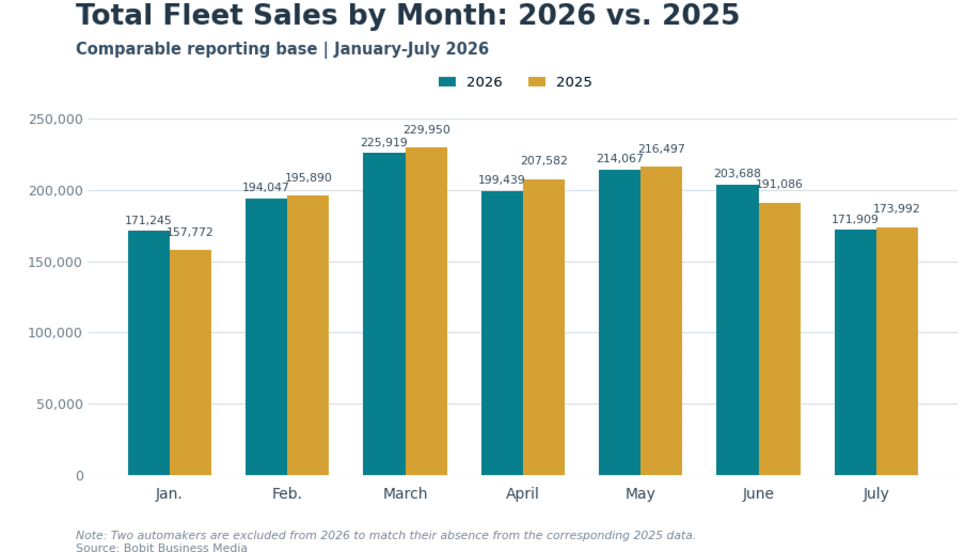
Fleet Sales Hold Steady as Commercial Gains Offset Rental Decline
Commercial and government fleet sales increased through July 2026, offsetting most of the decline in rental volume and leaving combined comparable fleet sales 0.5% above the same period last year.
Read More →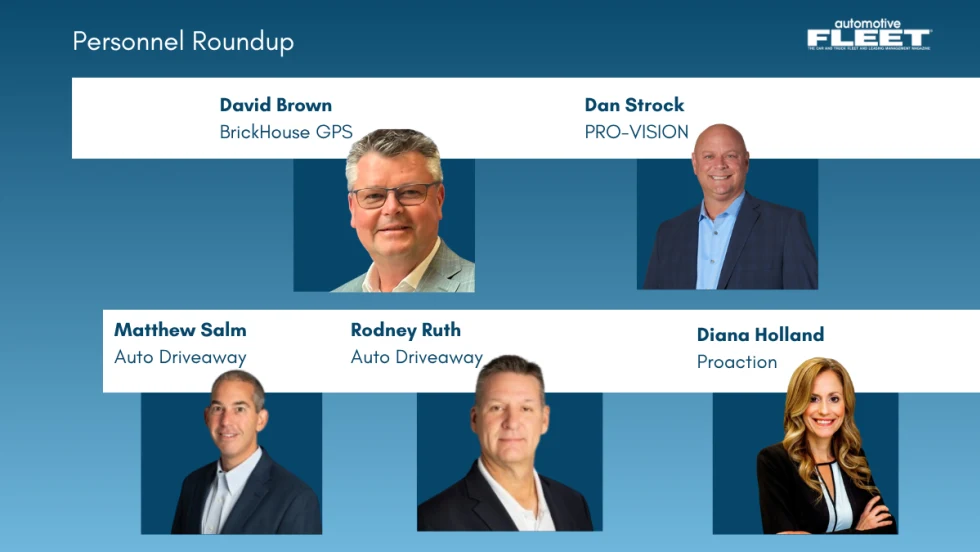
Personnel Update: BrickHouse GPS, PRO-VISION, Auto Driveaway, and Proaction
Check out the latest must-know fleet personnel updates from the last couple of months.
Read More →
What Comes Next for Auto Driveaway?
A new Auto Driveaway feature called Arrive provides recipients with live location updates and ETAs during the final hour of a vehicle move, while fleet customers continue to have end-to-end shipment visibility through the company's customer portal.
Read More →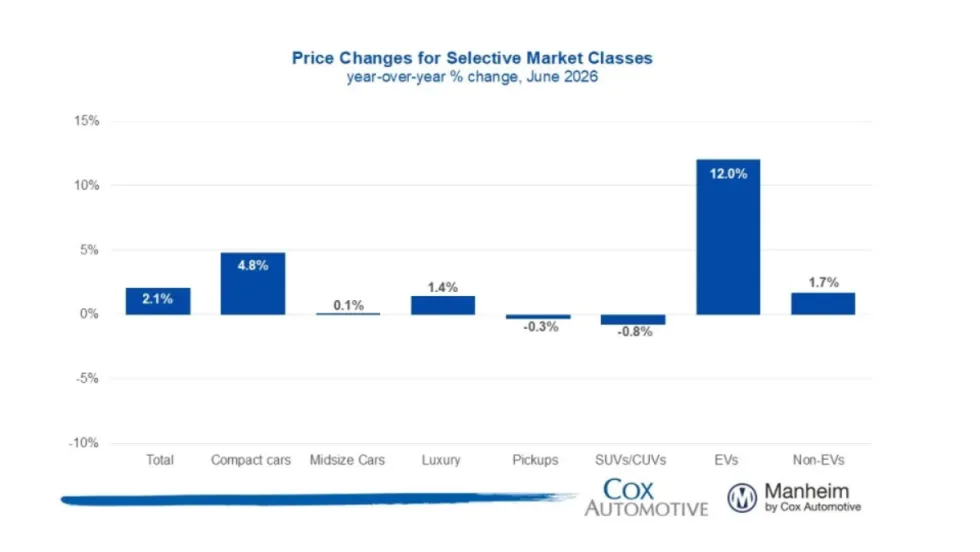
Manheim Index Shows Used-Vehicle Wholesale Prices Up 2.1% in June
The market is seeing stronger appreciation in older used vehicles this year, and the most affordable segments have been among the year’s best performers.
Read More →
Commercial Fleet Sales Contribute To June, YTD Gains
The fleet sector has boosted its vehicle purchases at a reliable pace in the first half of this year compared with 1H 2025.
Read More →
Stop Remarketing Electric Vehicles Like Gas Cars
The advantages and attributes of electric vehicles are upending the traditional remarketing cycle, requiring fleet sellers to rely on new factors and approaches detailed below.
Read More →
AP Fleet Management Expands Remarketing Program for Commercial Work Trucks
AP Fleet Management expanded its commercial vehicle remarketing program with dedicated resale services and an online marketplace for used work trucks.
Read More →
Used EVs Strengthen Overall Electric Vehicle Market
The latest sales data point to several reasons for the divergent trends in new and used EVs that can factor into fleet cycling decisions.
Read More →