
EV Sales, Days' Supply Show Deepening Downturn
November EV data shows sales falling to multi-year lows as inventory builds and pricing softens following the expiration of federal tax credits.

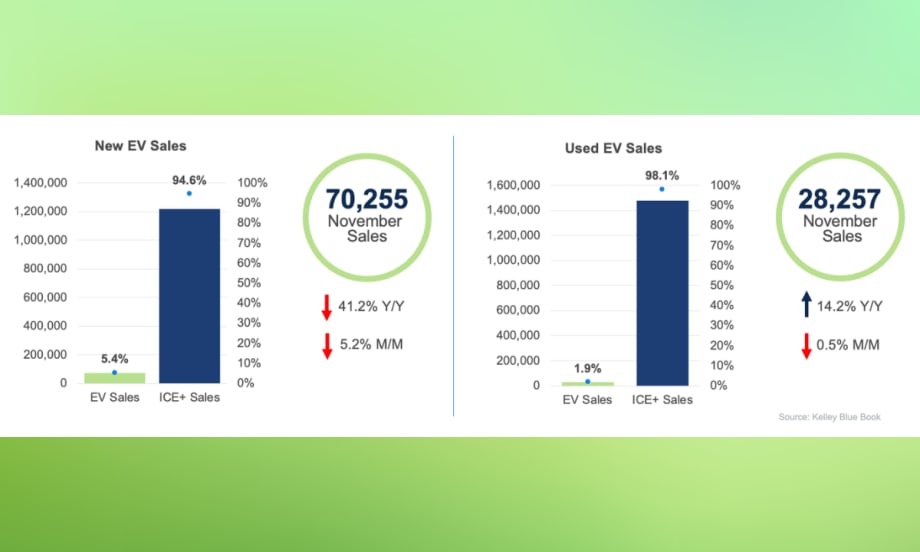
New EV sales fell sharply in November, reaching their lowest market share since early 2022, while used EV sales posted year-over-year growth despite a monthly dip.
Photo: Cox Automotive
November extended October’s post-incentive slowdown as the expiration of the federal EV tax credit continued to weigh on demand. New EV sales fell again, used sales eased slightly, and inventories rose sharply — especially on the new-vehicle side — while pricing softened across both segments.
EV Sales Decline Again in November
New EV Sales
New EV sales totaled an estimated 70,255 units, down 5.2% from October and down 41.2% year over year. EV share of total U.S. sales fell to 5.4%, the lowest since April 2022, down from 5.8% in October. Year-to-date EV sales remain 2.1% ahead of last year’s pace.
Top OEMs by volume:
Tesla: 39,800
Rivian: 4,500
Ford: 4,188
Chevrolet: 3,112
Hyundai: 2,853
Tesla’s volume dipped 2.1% month over month, but its share climbed to 56.7% as competitors posted steeper declines. Rivian led major brands with a 7.6% year-over-year gain and rose 14.1% from October.
Used EV Sales
Used EV sales reached 28,257 units, down 0.5% from October but up 14.2% year over year. Used EV market share held steady at 1.9%.
Top brands by used EV sales:
Tesla: 10,785
Ford: 2,094
Audi: 1,848
Chevrolet: 1,790
BMW: 1,596
Tesla continued to dominate at the model level, holding four of the top five spots. Among the top five brands, Audi posted the strongest month-over-month increase at 12.1%.
EV Pricing Softens in November
New EV Transaction Prices
The average transaction price (ATP) for new EVs slipped to $58,638, down 0.8% month over month but up 3.7% year over year. Incentives rebounded to $7,785, or 13.3% of ATP, up from October’s year-low 11.1%. The price premium over ICE+ vehicles narrowed to $9,475. Tesla’s ATP rose 1.5% month over month to $54,310.
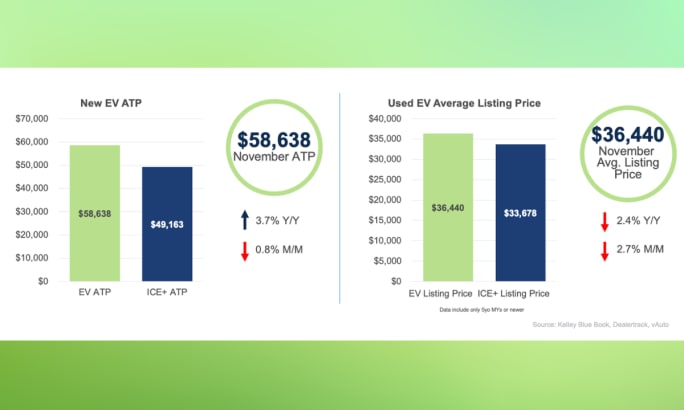
Average transaction prices for new EVs edged lower in November, while used EV listing prices declined both month over month and year over year as demand weakened.
Photo: Cox Automotive
Used EV Listing Prices
Used EV listing prices fell 2.7% month over month and 2.4% year over year to $36,440, narrowing the price premium over ICE+ vehicles to $2,762. Most brands posted monthly declines; Volvo (+3.5%) and Kia (+2.7%) were notable exceptions. Average used Tesla listing prices slipped 1.8% to $31,515. Forty-three models remained under $30,000, including the Tesla Model 3 at $23,583.
Days’ Supply Surges for New EVs
New EV Days’ Supply
New EV days’ supply surged to 149 days in November, up 80.2% from October and up 42.0% year over year, the highest level since February 2024. Toyota, Volkswagen, and Hyundai posted the highest days’ supply in the latest measure, while BMW had the leanest inventory.
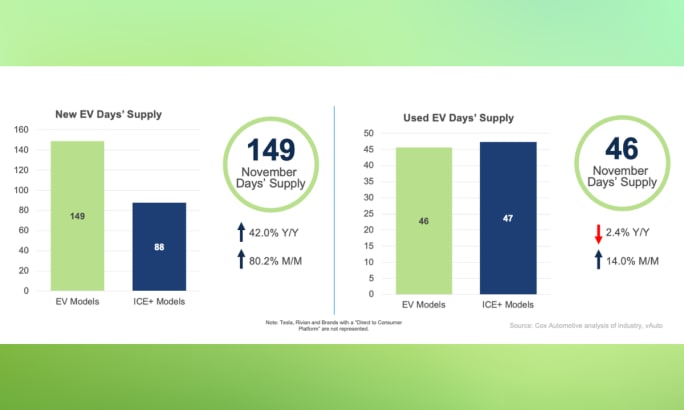
New EV inventory surged in November, pushing days’ supply to the highest level of 2024, while used EV supply rose but remained below ICE vehicle levels.
Photo: Cox Automotive
Used EV Days’ Supply
Used EV days’ supply rose to 46 days, up 14% from October but down 2.4% year over year, remaining below ICE+ levels for the eighth consecutive month. Among major brands, supply ranged from 37 days for Tesla to 56 days for Volkswagen. Note: Tesla figures reflect dealer-available inventory, excluding direct-to-consumer stock.
Market Outlook
November’s results reinforce the reset underway as EV demand adjusts to a post-incentive environment. With inventories elevated and pricing easing, near-term performance will likely depend on production discipline, targeted incentives, and strategies to rebuild consumer confidence while more closely matching supply to demand.
Originally posted on Charged Fleet
More Fleet
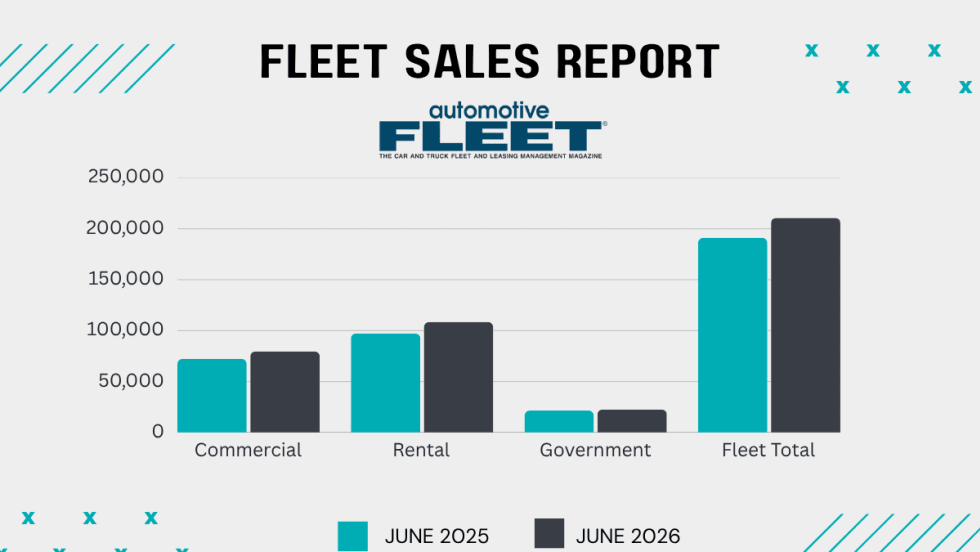
Commercial Fleet Sales Contribute To June, YTD Gains
The fleet sector has boosted its vehicle purchases at a reliable pace in the first half of this year compared with 1H 2025.
Read More →
Registration Opens for 2026 Fleet Forward Conference
Held on the East Coast for the first time, the Washington, D.C.-area event features expert-led education, a new IIHS Crash Test Experience, and collocation with the NAFA’s Fleet Safety Symposium.
Read More →
AP Fleet Management Expands Remarketing Program for Commercial Work Trucks
AP Fleet Management expanded its commercial vehicle remarketing program with dedicated resale services and an online marketplace for used work trucks.
Read More →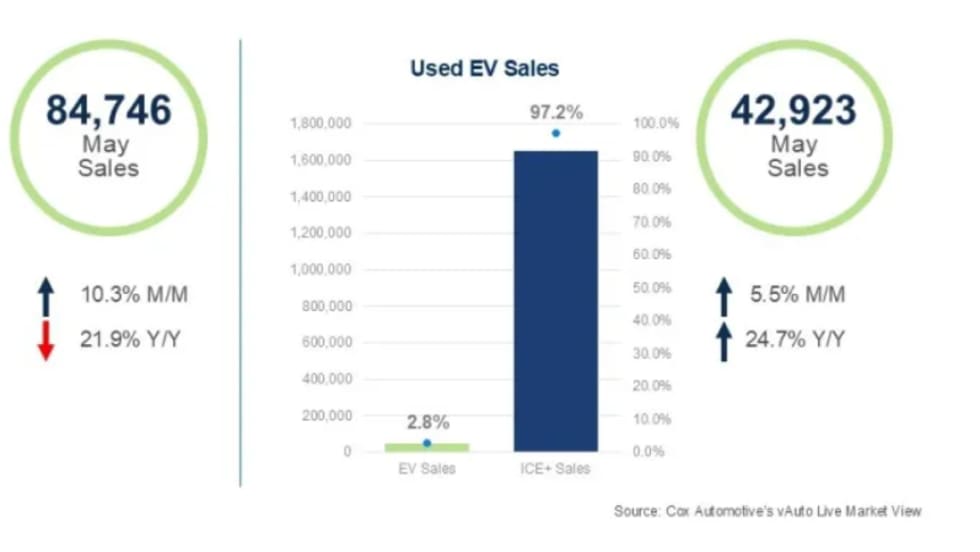
Used EVs Strengthen Overall Electric Vehicle Market
The latest sales data point to several reasons for the divergent trends in new and used EVs that can factor into fleet cycling decisions.
Read More →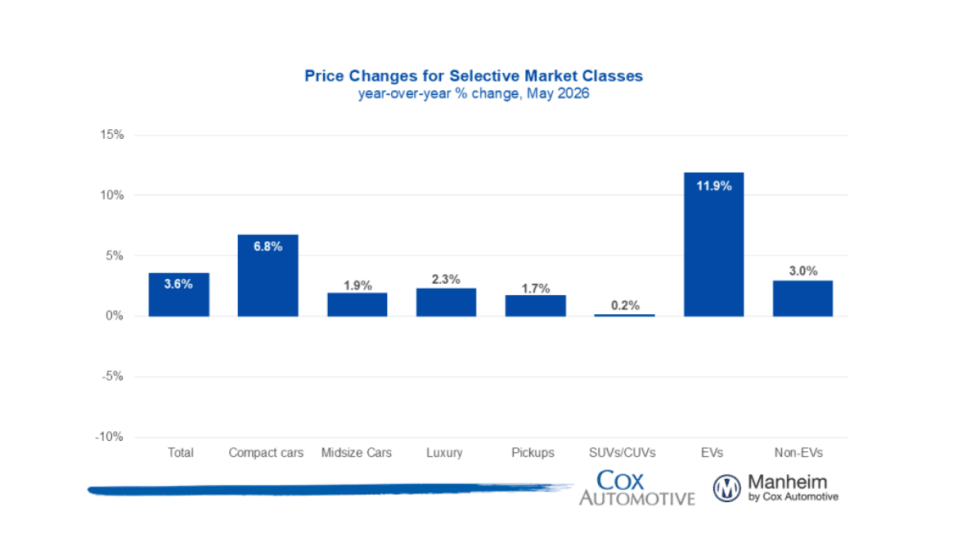
Wholesale Used Vehicle Market Sustains Moderate Rise In Values, Prices
Trends continue to normalize after a strong start to the year, as consumers contend with higher gas prices in the coming summer months.
Read More →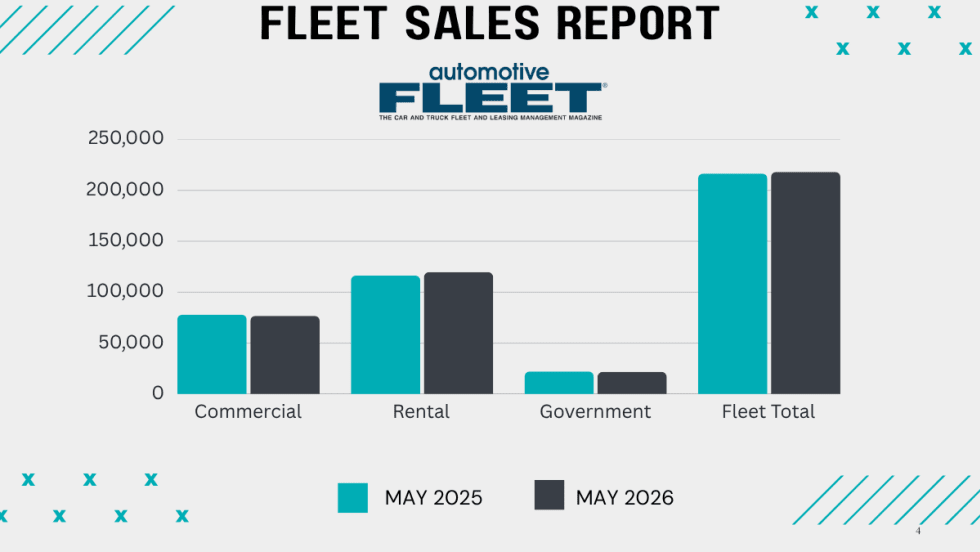
Commercial Fleet Sales Still Lead Sectors Despite May Mini Dip
The U.S. economy's continued growth and positive business investment are creating a favorable environment for fleet vehicle demand.
Read More →
The Data-Driven Haul: 5 Ways AI is Leveling the Playing Field in Auto Transport
Large and small transport fleets are becoming more competitive as predictive analytics and real-time data inform the logistics decision chain.
Read More →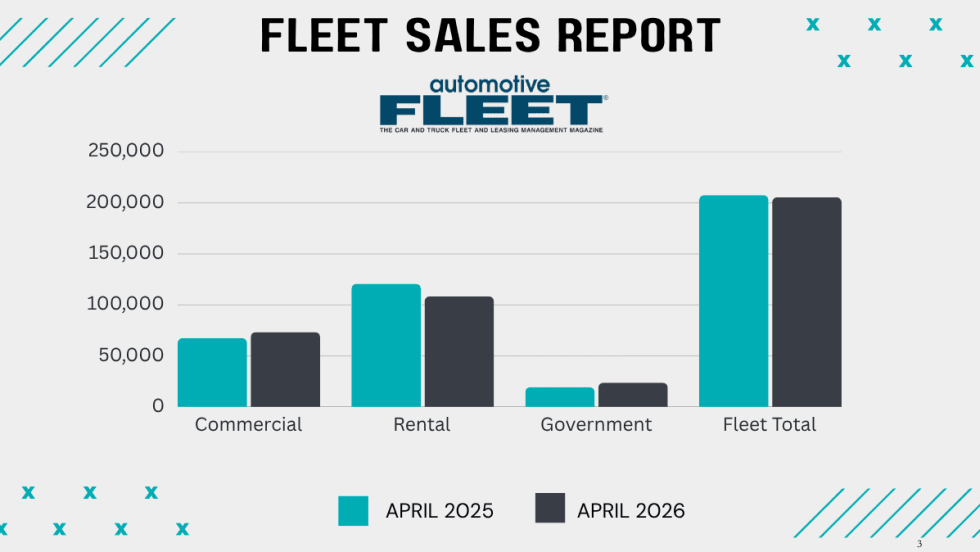
Commercial Fleet Sales Show Healthy Gains
So far, the fleet sector is outshining government and rental fleet sales this year as economic growth spurs more business investment.
Read More →
CAR 2026 Recap Part 2: Closing the Gap Between Data & Remarketing Value
The second half of CAR 2026 examined how fleets can translate lifecycle strategy, vehicle data, and market shifts into higher real-world results.
Read More →
CAR2026 in Two Words: Velocity, Value (Part 1)
The 2026 Conference of Automotive Remarketing convened with a mandate to involve a new constituency — fleet managers — and an updated mission to demonstrate unrealized value in de-fleeted vehicles.
Read More →