

Related News: EVs Set Market Share Record For Light-Duty Sales
EV Market Resets With Softer Demand, Lower Prices
Near-term EV market performance is expected to remain uneven, while elevated new-vehicle inventory and softer consumer demand may continue to pressure sales and pricing.
February 18, 2026
New EV sales declined in January, but used EV sales posted strong gains year over year and month over month.
Photo: Cox Automotive
3 min to read
January marked a reset for the EV market. New-vehicle demand declined and inventory expanded, while used EV sales increased and supply tightened, according to figures from Cox Automotive released Feb. 13. Pricing moved lower in both segments, narrowing EV-to-ICE premiums.
Sales
New EV Sales
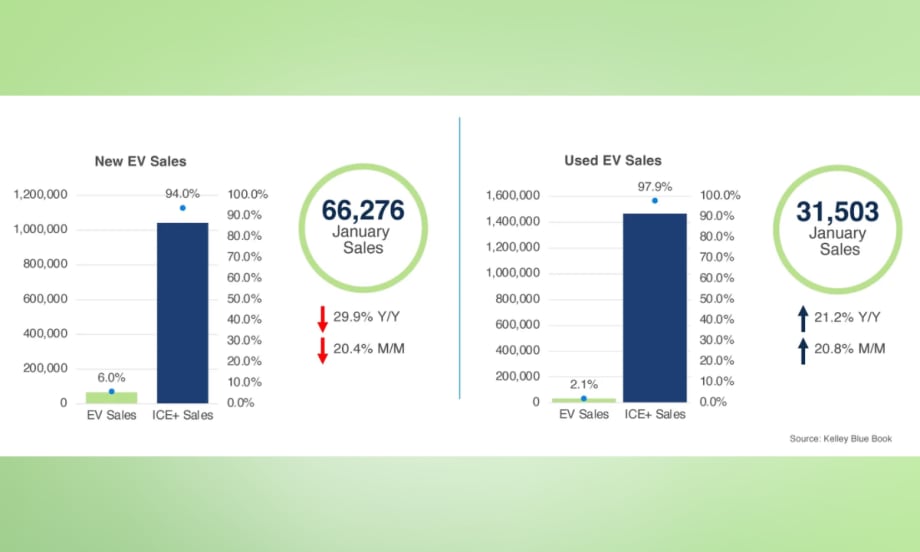
January's new EV sales totaled an estimated 66,276 units, down 29.9% year over year and 20.4% month over month. EV share of total new-vehicle sales was 6.0%.
The top five brands by volume were Tesla (40,100), Hyundai (3,074), Toyota (2,794), Cadillac (2,716), and Rivian (2,516). Tesla volume fell 17% month over month, but its market share increased to 60.5%, up from 57.3% in December, as most competitors posted steeper declines. Ford, which ranked second in December, saw volume drop 56.8% to 2,174 units and fell out of the top five. Toyota was a notable exception to the broader decline, with sales up 34.5% month over month. Lexus, Audi, and Subaru also recorded gains.
Used EV Sales
Used EV sales reached 31,503 units in January, up 21.2% year over year and 20.8% from December. Used EV market share rose to 2.1%.
Tesla led with 12,416 vehicles, followed by Audi (2,002), Ford (1,995), Chevrolet (1,959), and BMW (1,842). Most brands posted month-over-month increases. Cadillac, Rivian, Porsche, and GMC recorded modest declines. Audi replaced Nissan in the top five, with sales up 63.4% month over month.
Prices
New EV Average Transaction Price
The average transaction price (ATP) for new EVs was $55,715 in January, down 0.6% year over year and 3.1% month over month. The EV premium over ICE+ vehicles narrowed to $7,098, the smallest gap since July 2025.
Incentives averaged $6,918, or 12.4% of ATP, down from 18.3% in December and below the 2025 full-year average of 13.7%. Tesla’s ATP declined 2% to $52,628. Among high-volume brands, Mercedes-Benz (+7.9%) and Ford (+6.6%) recorded the largest month-over-month ATP increases, while Volvo (-23.5%) and Audi (-3.8%) saw the steepest declines.
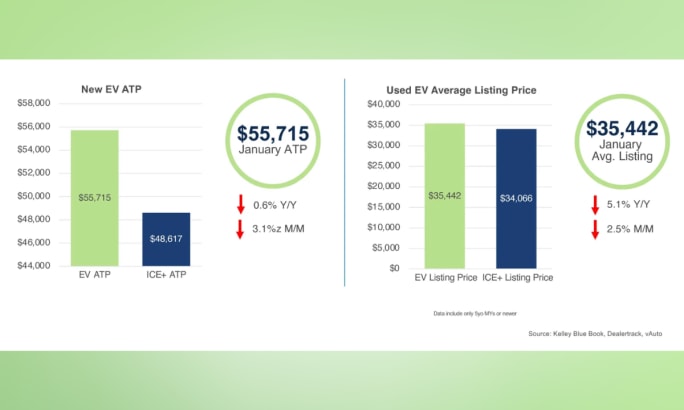
New EV average transaction prices and used EV listing prices both declined in January, further narrowing the price gap with ICE vehicles.
Photo: Cox Automotive
Used EV Listing Price
The average listing price for used EVs was $35,442, down 5.1% year over year and 2.5% month over month. The price premium over ICE+ vehicles narrowed to $1,376, down from $2,591 in December.
Among high-volume brands, Nissan (-3.2%), Kia (-2.8%), and Mercedes-Benz (-2.3%) recorded the largest month-over-month price declines. Audi increased 4.8% to $39,502 as sales rose. Tesla prices edged up 0.6% to $31,760.
Supply
New EV Days’ Supply
New EV days’ supply increased to 168 days in January, up 55.8% year over year and 24.8% month over month. The gap between EV and ICE+ days’ supply widened to 71 days, compared with 59 days in December.
At 168 days, new EV supply reached its highest level since July 2024 and is nearly four times higher than September’s 46-day low. EV supply was below ICE+ levels as recently as late October; that gap has since reversed by about 78 days.
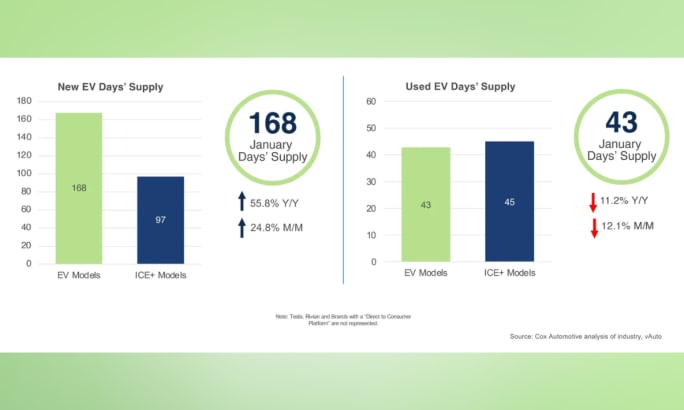
New EV inventory rose sharply in January, while used EV supply tightened for the tenth consecutive month compared to ICE vehicles.
Photo: Cox Automotive
Used EV Days’ Supply
Used EV days’ supply declined to 43 days, down 11.2% year over year and 12.1% month over month. Used EV supply has remained below ICE+ levels for 10 consecutive months.
Supply ranged from 35 days (Audi and Tesla) to 62 days (Porsche). Audi recorded the largest month-over-month decline, down 23 days, reflecting stronger sales. Tesla figures reflect vehicles available through traditional dealerships and exclude Tesla-owned outlets.
Outlook
Near-term EV market performance is expected to remain uneven. Elevated new-vehicle inventory and softer consumer demand may continue to pressure sales and pricing. Used EVs are likely to remain comparatively stronger, supported by improving affordability and narrowing price gaps versus ICE+ vehicles.
Market momentum will depend on production discipline, targeted incentive strategies, and sustained consumer interest in more affordable EV models without further expanding inventory.
Originally posted on Charged Fleet
More Fleet
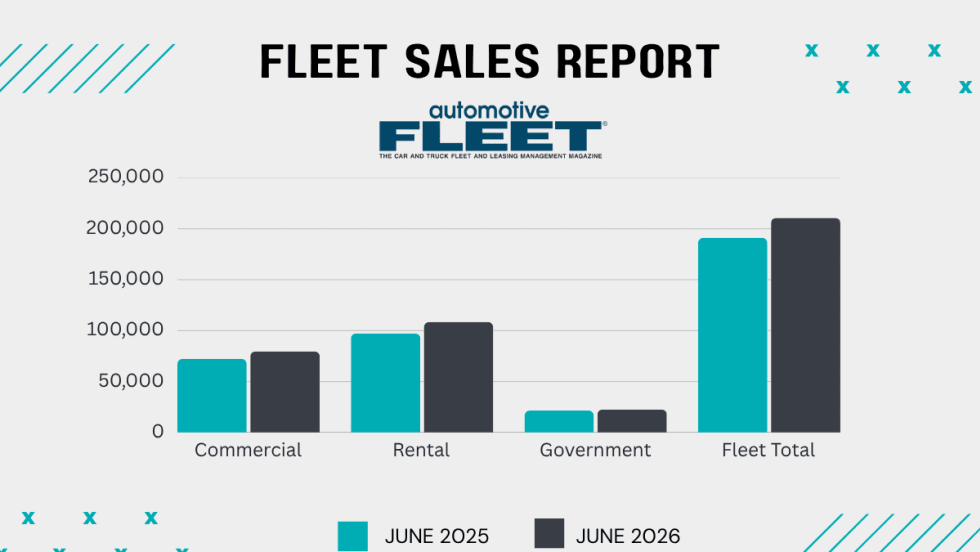
Commercial Fleet Sales Contribute To June, YTD Gains
The fleet sector has boosted its vehicle purchases at a reliable pace in the first half of this year compared with 1H 2025.
Read More →
Registration Opens for 2026 Fleet Forward Conference
Held on the East Coast for the first time, the Washington, D.C.-area event features expert-led education, a new IIHS Crash Test Experience, and collocation with the NAFA’s Fleet Safety Symposium.
Read More →
AP Fleet Management Expands Remarketing Program for Commercial Work Trucks
AP Fleet Management expanded its commercial vehicle remarketing program with dedicated resale services and an online marketplace for used work trucks.
Read More →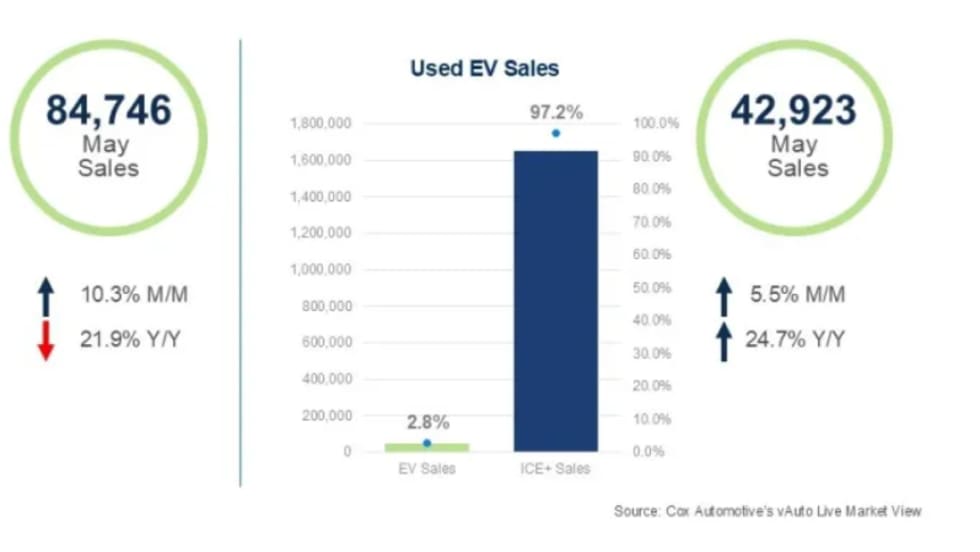
Used EVs Strengthen Overall Electric Vehicle Market
The latest sales data point to several reasons for the divergent trends in new and used EVs that can factor into fleet cycling decisions.
Read More →
Wholesale Used Vehicle Market Sustains Moderate Rise In Values, Prices
Trends continue to normalize after a strong start to the year, as consumers contend with higher gas prices in the coming summer months.
Read More →
Commercial Fleet Sales Still Lead Sectors Despite May Mini Dip
The U.S. economy's continued growth and positive business investment are creating a favorable environment for fleet vehicle demand.
Read More →
The Data-Driven Haul: 5 Ways AI is Leveling the Playing Field in Auto Transport
Large and small transport fleets are becoming more competitive as predictive analytics and real-time data inform the logistics decision chain.
Read More →
Commercial Fleet Sales Show Healthy Gains
So far, the fleet sector is outshining government and rental fleet sales this year as economic growth spurs more business investment.
Read More →
CAR 2026 Recap Part 2: Closing the Gap Between Data & Remarketing Value
The second half of CAR 2026 examined how fleets can translate lifecycle strategy, vehicle data, and market shifts into higher real-world results.
Read More →
CAR2026 in Two Words: Velocity, Value (Part 1)
The 2026 Conference of Automotive Remarketing convened with a mandate to involve a new constituency — fleet managers — and an updated mission to demonstrate unrealized value in de-fleeted vehicles.
Read More →