



ADESA Reports Fourth Quarter and Full-Year 2004 Results
CARMEL, IN – For the fourth quarter 2004, the ADESA reported net income of $21.9 million or $0.24 per share, on revenue of $224.8 million.
CARMEL, IN – For the fourth quarter 2004, the ADESA reported net income of $21.9 million or $0.24 per share, on revenue of $224.8 million. The company's fourth quarter results included incremental after-tax interest and corporate expenses of $2.1 million and $2.9 million, or an aggregate $0.05 per share compared to the fourth quarter of 2003.
Recent Highlights:
GAAP income from continuing operations for 2004 was $109.5 million or $1.20 per share.
Adjusted income from continuing operations for 2004 was $119.8 million or $1.31 per share, which excludes $10.3 million of non-recurring transaction costs or $0.11 per share.
Auction and related services income from continuing operations grew 10 percent for the fourth quarter and 20 percent for the year.
Dealer financing income grew 17 percent for the quarter and 12 percent for the year.
Repurchased 4.4 million shares of common stock for $86.7 million during the fourth quarter 2004.
Expanded salvage operations into Clearwater, Fla., and the greater Hartford, Conn., area shortly after the end of 2004 and recently opened new AFC loan production offices in North and South Carolina.
Tripled both the number of dealers registered for on-line auctions and the number of lanes equipped with LiveBlock, resulting in over 675,000 vehicles being offered for sale in a dual bidding forum during 2004.
Achieved record fourth quarter AFC loan transactions of 269,000, 13% above 2003.
For the fourth quarter of 2004, ADESA reported revenue of $224.8 million compared with $217.8 million in the fourth quarter of 2003. Increases in revenue per vehicle sold, the number of loan transactions, and revenue per loan transaction contributed to the revenue growth, which more than offset a 4-percent decline in vehicles sold at ADESA auctions. Canadian currency translation favorably impacted revenue by $3 million.
Net income for the current quarter was $21.9 million or $0.24 per share, compared with net income of $24.9 million, or $0.28 per share in the fourth quarter of 2003. Results for the current quarter included incremental after- tax interest and corporate expenses of $2.1 million and $2.9 million, or an aggregate $0.05 per share. The fourth quarter of 2003 included a non-recurring gain on the sale of real estate of $2.1 million after-tax, or $0.02 per share. The incremental interest and corporate expenses in the current quarter were the result of the Company's 2004 debt refinancing and additional infrastructure required to operate as an independent public company.
For the quarter ended December 31, 2004, ADESA had approximately 92.4 million shares outstanding on a weighted average diluted basis, compared with 88.6 million shares for the same quarter in 2003. The share increase as compared with the fourth quarter of 2003 is primarily the result of the Company's initial public offering of 6.25 million common shares in the second quarter of 2004, net of the effect of its share repurchases of approximately 4.4 million shares in the fourth quarter of 2004.
Fourth quarter 2004 income from continuing operations for Auction and Related Services increased 10 percent to $16.9 million, compared with $15.3 million in the fourth quarter of 2003. Due primarily to favorable Canadian currency translation and increased ancillary services revenue, as well as the benefits of selective fee increases implemented earlier in 2004, revenue per vehicle sold increased to $433 compared to $410 for the fourth quarter of 2003.
ADESA’s Dealer Financing segment also experienced strong growth in the fourth quarter of 2004, as income from continuing operations increased 17 percent to $11.2 million for the current quarter, compared with $9.6 million in the fourth quarter of 2003. Loan transaction volume increased 13% to a fourth quarter record of 269,000 while revenue per loan transaction increased from $110 in 2003 to $115 in 2004.
For the year ended December 31, 2004, ADESA reported revenue of $931.6 million and net income of $105.3 million or $1.15 per share, compared with revenue of $911.9 million and net income of $115.1 million or $1.30 per share for 2003. Income from continuing operations was $109.5 million for 2004 compared with $114.8 million in 2003. Canadian currency translation favorably impacted revenue by $11.5 million in 2004.
Results for 2004 included non-recurring transaction costs of $10.3 million net of tax, or $0.11 per share and a loss from discontinued operations of $4.2 million net of tax, or $0.05 per share. Absent these non-recurring costs and the results of discontinued operations, the Company would have reported net income of $119.8 million or $1.31 per share.
Financial results for 2004 also included incremental interest and corporate expenses of approximately $5.3 million and $7.3 million net of tax, or an aggregate $0.14 per share. ADESA's 2003 financial results included a non-recurring gain on the sale of real estate of $2.1 million after-tax, or $0.03 per share. For 2004, the Company had approximately 91.5 million shares outstanding on a weighted average diluted basis, compared with 88.6 million shares in 2003.
ADESA expects 2005 earnings to be approximately $1.37 to $1.43 per share, prior to the impact of the new Financial Accounting Standards Board (FASB) pronouncement regarding expensing of stock options. This range is based on an estimated weighted average diluted share count of approximately 92 million shares.
This guidance includes expected increases in interest expense ($0.05 per share) and corporate expenses ($0.03 per share) resulting from a full year of ADESA as an independent public company, as well as an expected increase in depreciation and amortization ($0.02 per share). ADESA's effective tax rate is expected to be between 39.5 percent and 40 percent in 2005.
More Operations

FLD Promotes Three Executives in Leadership Changes
FLD has promoted three longtime executives, naming Gary Mott CEO, Richard Mallek president, and Ron Sanders managing partner.
Read More →
CAS Automotive Launches Remarketing Service for Damaged, Surplus Equipment
Damaged Equipment expands CAS Automotive’s vehicle remarketing model to commercial equipment, targeting fleet operators, insurers, equipment dealers, and rental companies.
Read More →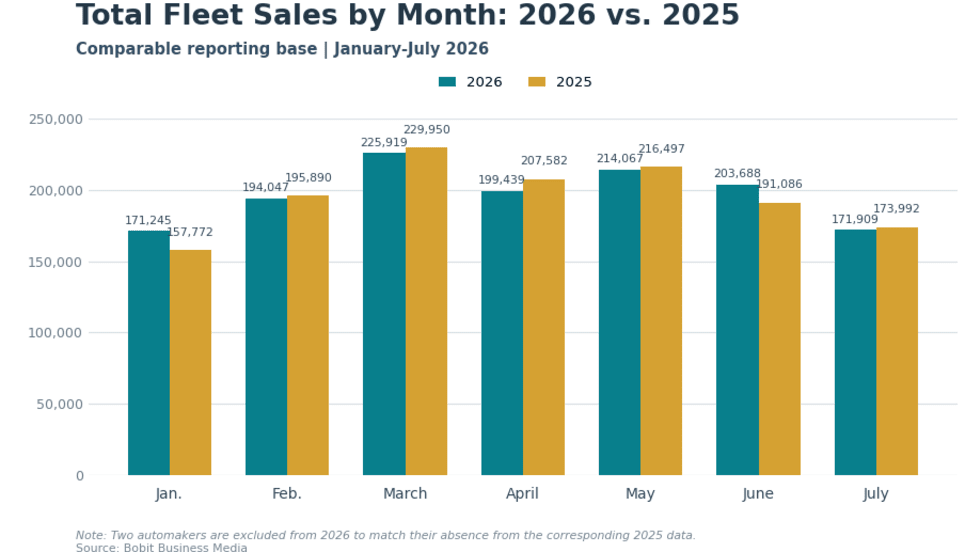
Fleet Sales Hold Steady as Commercial Gains Offset Rental Decline
Commercial and government fleet sales increased through July 2026, offsetting most of the decline in rental volume and leaving combined comparable fleet sales 0.5% above the same period last year.
Read More →
Personnel Update: BrickHouse GPS, PRO-VISION, Auto Driveaway, and Proaction
Check out the latest must-know fleet personnel updates from the last couple of months.
Read More →
What Comes Next for Auto Driveaway?
A new Auto Driveaway feature called Arrive provides recipients with live location updates and ETAs during the final hour of a vehicle move, while fleet customers continue to have end-to-end shipment visibility through the company's customer portal.
Read More →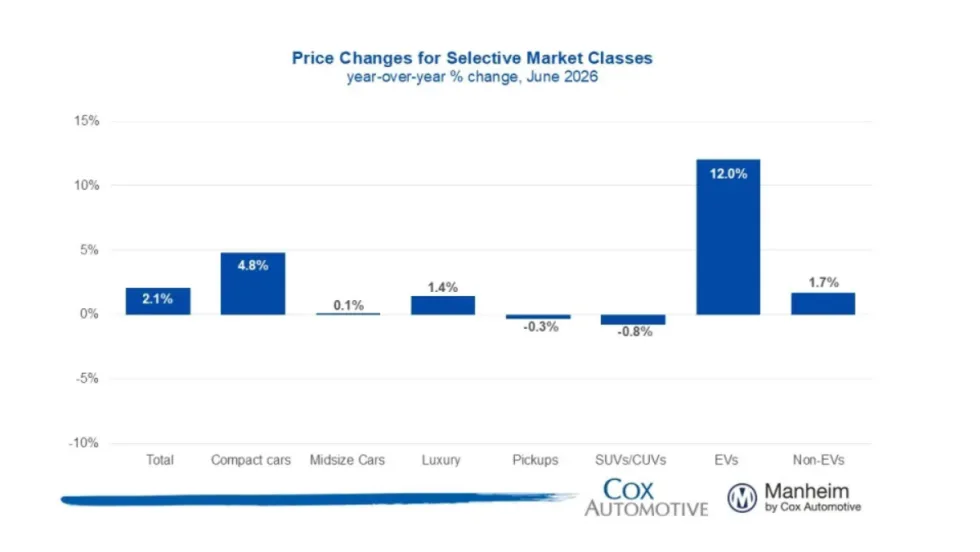
Manheim Index Shows Used-Vehicle Wholesale Prices Up 2.1% in June
The market is seeing stronger appreciation in older used vehicles this year, and the most affordable segments have been among the year’s best performers.
Read More →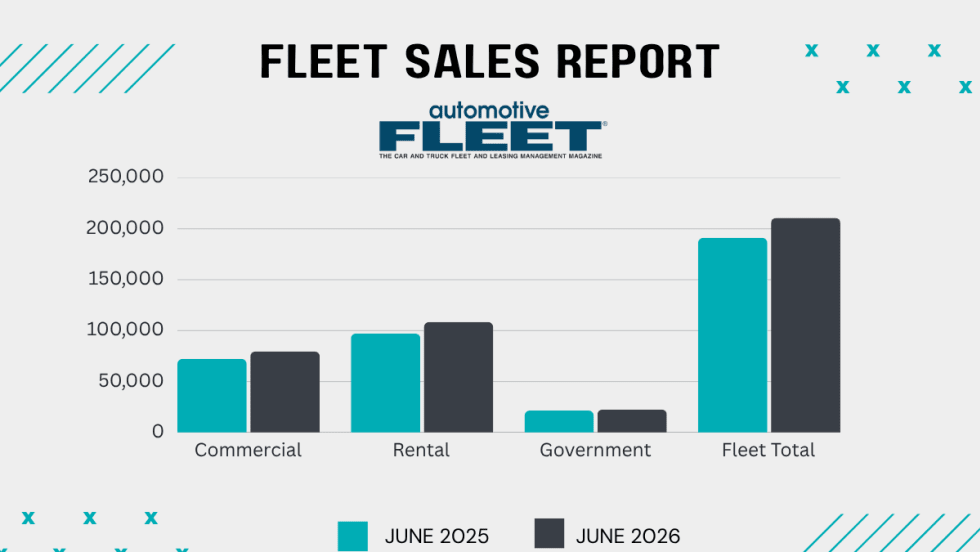
Commercial Fleet Sales Contribute To June, YTD Gains
The fleet sector has boosted its vehicle purchases at a reliable pace in the first half of this year compared with 1H 2025.
Read More →
Stop Remarketing Electric Vehicles Like Gas Cars
The advantages and attributes of electric vehicles are upending the traditional remarketing cycle, requiring fleet sellers to rely on new factors and approaches detailed below.
Read More →
AP Fleet Management Expands Remarketing Program for Commercial Work Trucks
AP Fleet Management expanded its commercial vehicle remarketing program with dedicated resale services and an online marketplace for used work trucks.
Read More →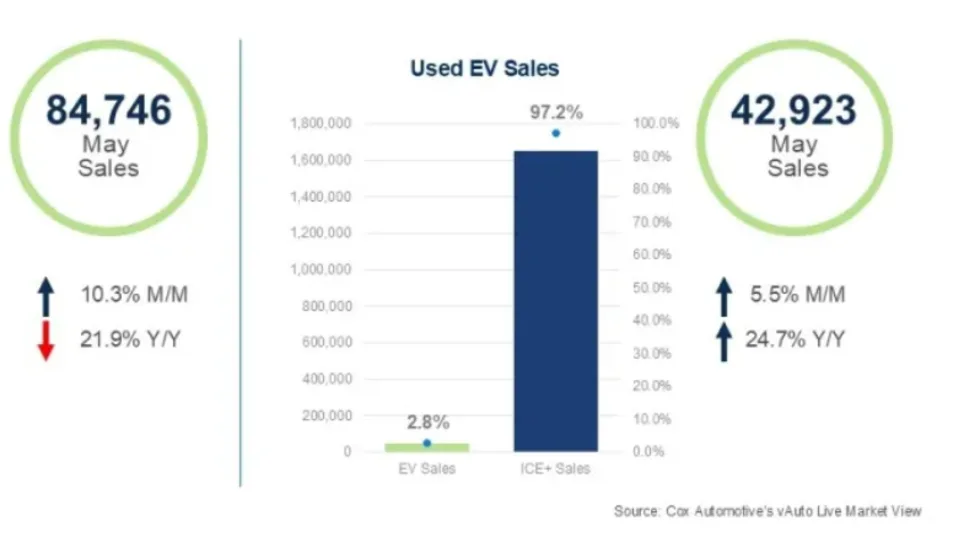
Used EVs Strengthen Overall Electric Vehicle Market
The latest sales data point to several reasons for the divergent trends in new and used EVs that can factor into fleet cycling decisions.
Read More →