
TCO Champs: Crossovers or Sedans?
As consumers and automakers continue to migrate away from sedans toward crossovers, there are no clear winners when analyzing total cost of ownership of individual models.

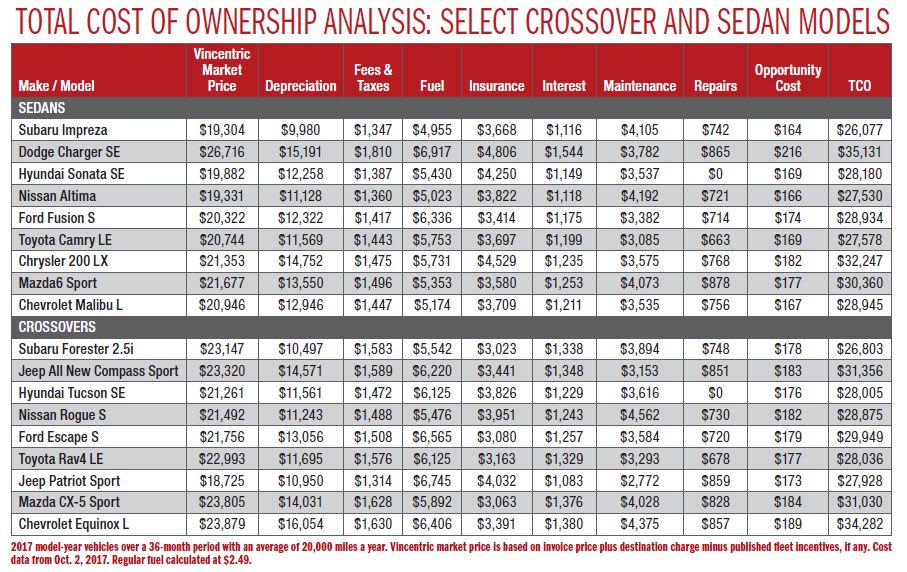
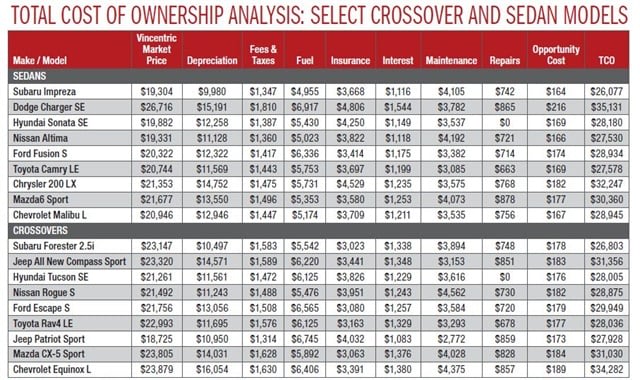
2017 model-year vehicles over a 36-month period with an average of 20,000 miles a year. Vincentric market price is based on invoice price plus destination charge minus published fleet incentives, if any. Cost data from Oct. 2, 2017. Regular fuel calculated at $2.49.
The inflection point came near the end of the 2014 calendar year, when sales of crossover utility vehicles surpassed compact and midsize car sales in the U.S. We’ve never looked back.
Analysts say consumers prefer crossovers for their high stature, roominess, car-like ride, and (relatively) good fuel economy. As fleet drivers are consumers themselves, fleet selectors have migrated toward crossovers as well.
Automakers have responded with more crossover model choices, while used sedans have not fared well recently in the secondary market. However, this doesn’t complete the total cost of ownership (TCO) picture.
For actual fleet acquisitions, a model-to-model analysis that takes into account all costs is more beneficial.
With the help of Vincentric, we compared TCO for popular midsize sedan and compact crossover fleet models.
For the analysis, Vincentric calculated its standard eight cost elements: depreciation, financing, fees and taxes, fuel, insurance, maintenance, opportunity cost, and repairs. This analysis covers a 36-month period with an average of 20,000 miles a year.
Cost Breakdowns
Each of the models chosen had an initial capitalized cost of $18,725 to $26,716 based on Vincentric’s Market Price, which calculates initial cost as invoice price plus destination charge minus fleet incentives. An analysis of these individual costs provided some interesting insights.
With the obvious popularity of crossovers, total depreciation — the largest single cost — did not favor crossovers over sedans.
Equinox, Escape, CX-5, Rogue, Forester, and RAV4 models depreciated more than their sedan counterparts, while Charger, 200, and Sonata depreciated more than their crossover colleagues.
Not surprisingly, the models that depreciated more carry a higher initial cost, except in one instance: The
Hyundai Tucson has a higher initial cost yet depreciates less than the Sonata sedan.
Total fuel costs are uniformly in favor of the sedans in our analysis, with one exception: The 2017 Dodge Charger will cost the user close to $700 more in fuel over a three-year period than its crossover comparison, the 2017 Jeep (“All New”) Compass.
Interestingly, total insurance costs favored the crossovers, with the exception of the Nissan Altima, which beats the Nissan Rogue in the category.
Maintenance costs are almost evenly split. Five crossover models (Equinox, Escape, Tucson, Rogue, and RAV4) are projected to cost more in maintenance, while four sedan models (200, Charger, Mazda6, and Impreza) are projected to cost more than their crossover counterparts.
TCO Winners
When it comes to overall total cost of ownership in this analysis, there is no clear winner between the crossover and sedan segments.
The Subaru Impreza sedan takes the lowest TCO prize, followed by Subaru Forester, a crossover. From there, two more sedans — Altima and Camry — come in third and fourth, followed by three crossovers — Patriot, Tucson, and RAV4 — in the fifth, sixth, and seventh spots.
After Subaru’s claiming of the first and second spots, the ranking is also not necessarily skewed toward certain manufacturers.
Not accounted for in this analysis are additional unpublished incentives available on many of these models. Though impossible to capture here, additional incentives skew overall ownership costs.
This analysis also clarifies a general rule of thumb that is worth reiterating, especially for smaller fleet operators — vehicles with lower initial costs do not necessarily correlate to a lower overall TCO. The 18 models analyzed here show that choosing the lowest cost out the door is not better on your fleet pocketbook in the long run.
Finally, while analyzing total cost of ownership is essential, it’s still a numbers analysis. The so-called “soft benefits” of crossovers — their ride, roominess, and overall appeal — may well be enough to tip the scales to acquiring them instead of sedans.
2017 model-year vehicles over a 36-month period with an average of 20,000 miles a year. Vincentric market price is based on invoice price plus destination charge minus published fleet incentives, if any. Cost data from Oct. 2, 2017. Regular fuel calculated at $2.49.
Originally posted on Work Truck Online
More Fleet
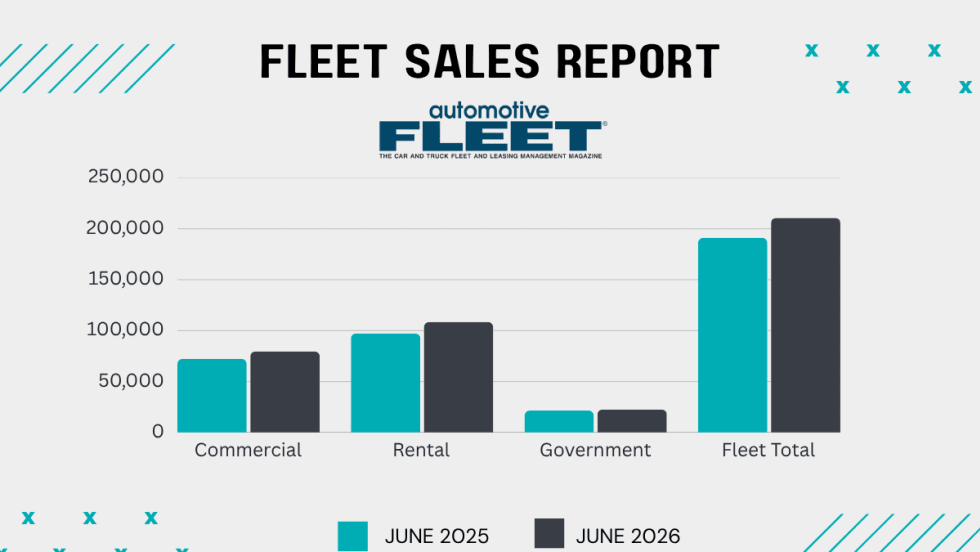
Commercial Fleet Sales Contribute To June, YTD Gains
The fleet sector has boosted its vehicle purchases at a reliable pace in the first half of this year compared with 1H 2025.
Read More →
Registration Opens for 2026 Fleet Forward Conference
Held on the East Coast for the first time, the Washington, D.C.-area event features expert-led education, a new IIHS Crash Test Experience, and collocation with the NAFA’s Fleet Safety Symposium.
Read More →
AP Fleet Management Expands Remarketing Program for Commercial Work Trucks
AP Fleet Management expanded its commercial vehicle remarketing program with dedicated resale services and an online marketplace for used work trucks.
Read More →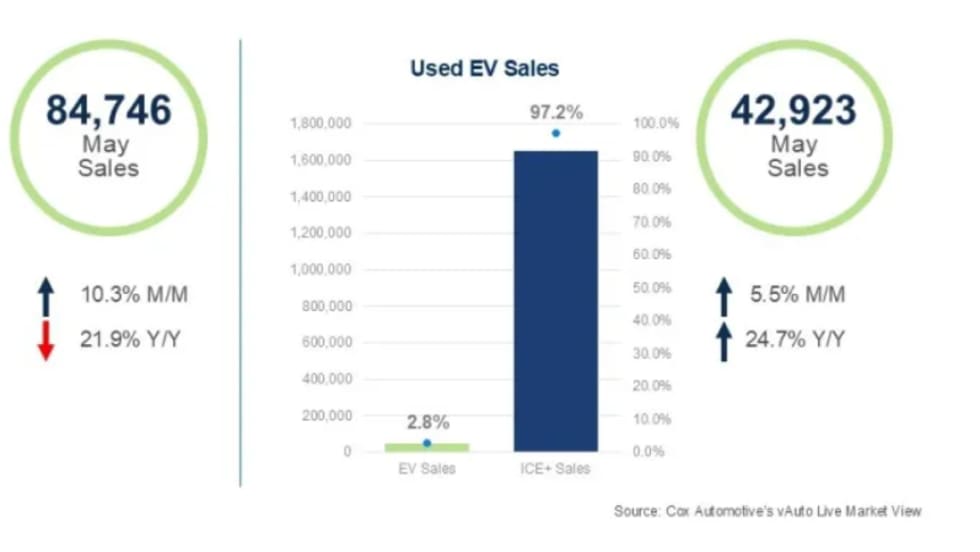
Used EVs Strengthen Overall Electric Vehicle Market
The latest sales data point to several reasons for the divergent trends in new and used EVs that can factor into fleet cycling decisions.
Read More →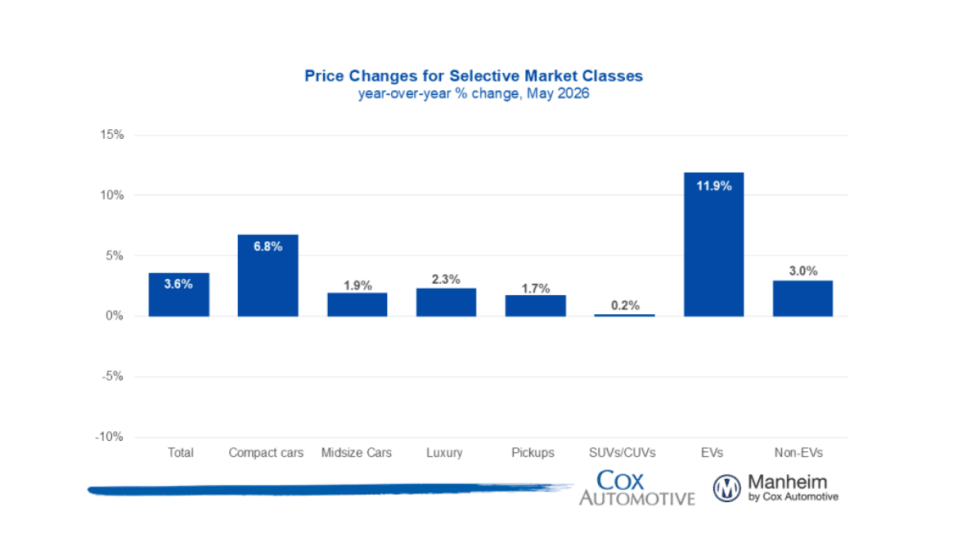
Wholesale Used Vehicle Market Sustains Moderate Rise In Values, Prices
Trends continue to normalize after a strong start to the year, as consumers contend with higher gas prices in the coming summer months.
Read More →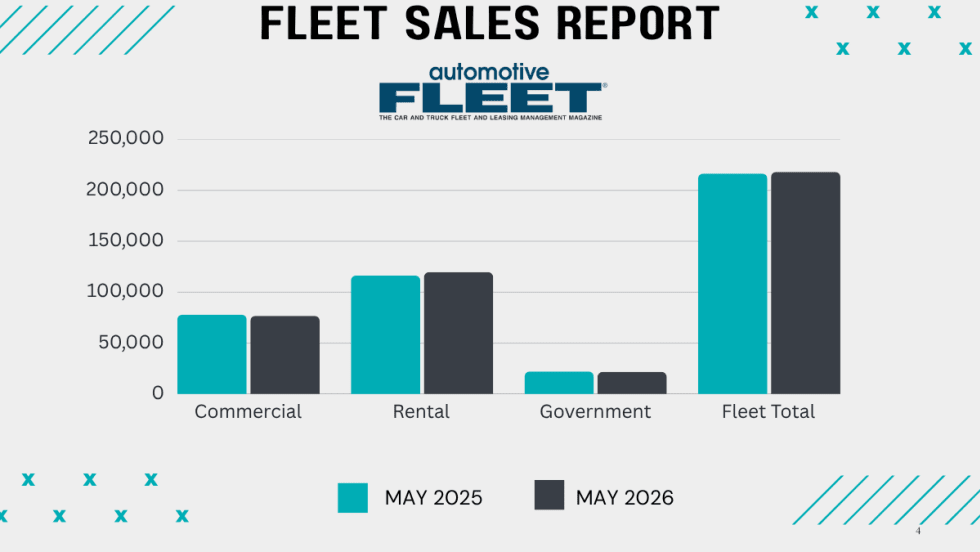
Commercial Fleet Sales Still Lead Sectors Despite May Mini Dip
The U.S. economy's continued growth and positive business investment are creating a favorable environment for fleet vehicle demand.
Read More →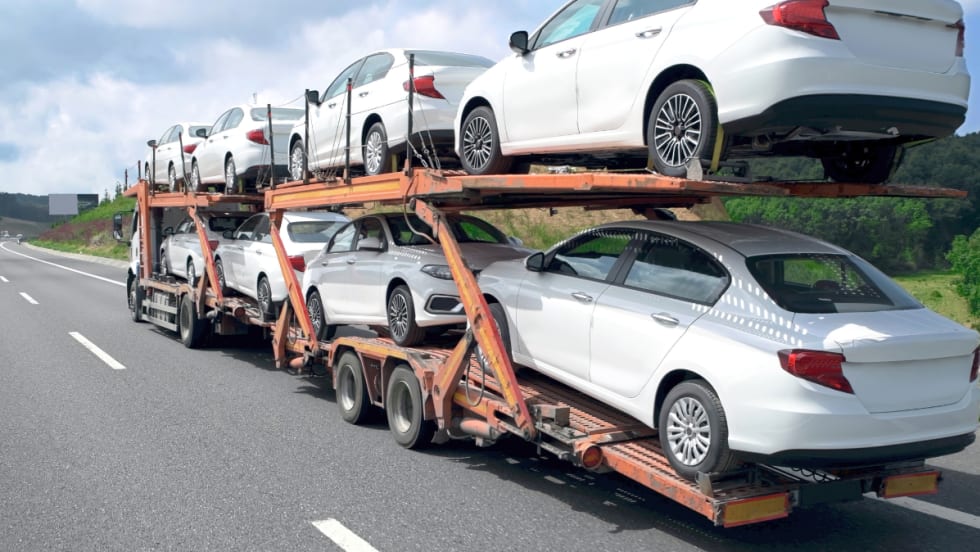
The Data-Driven Haul: 5 Ways AI is Leveling the Playing Field in Auto Transport
Large and small transport fleets are becoming more competitive as predictive analytics and real-time data inform the logistics decision chain.
Read More →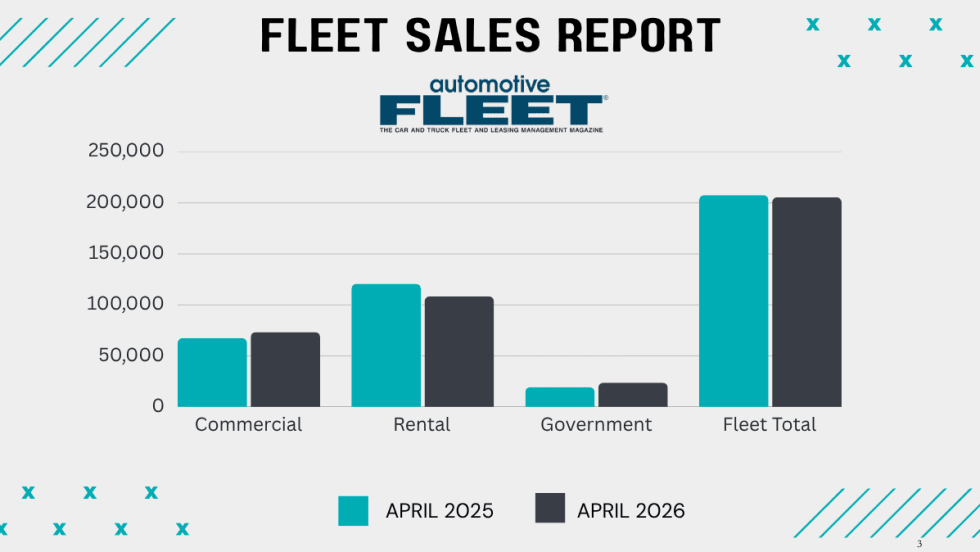
Commercial Fleet Sales Show Healthy Gains
So far, the fleet sector is outshining government and rental fleet sales this year as economic growth spurs more business investment.
Read More →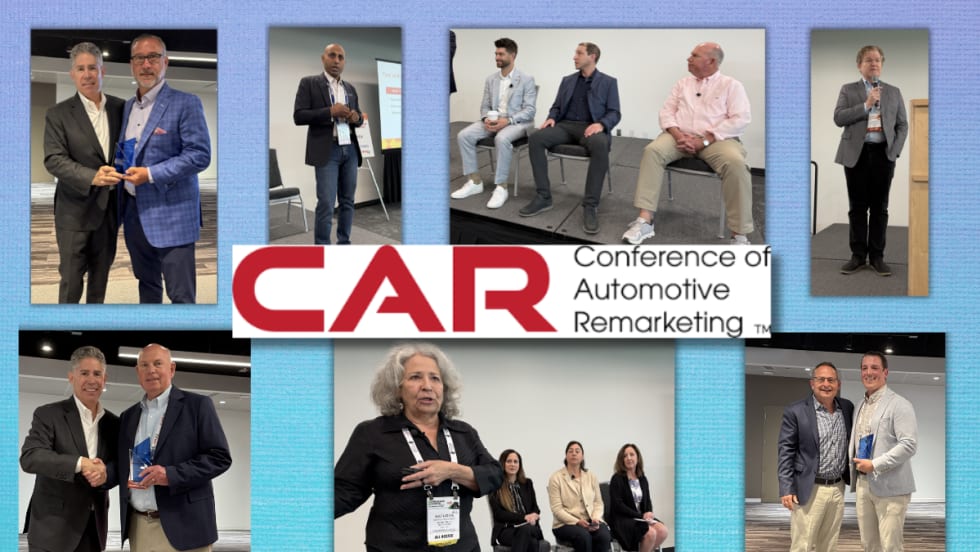
CAR 2026 Recap Part 2: Closing the Gap Between Data & Remarketing Value
The second half of CAR 2026 examined how fleets can translate lifecycle strategy, vehicle data, and market shifts into higher real-world results.
Read More →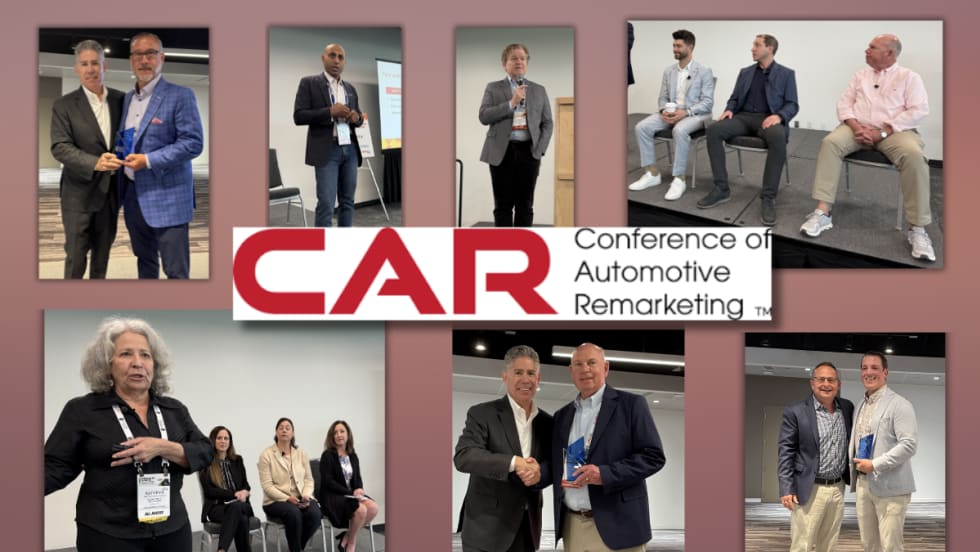
CAR2026 in Two Words: Velocity, Value (Part 1)
The 2026 Conference of Automotive Remarketing convened with a mandate to involve a new constituency — fleet managers — and an updated mission to demonstrate unrealized value in de-fleeted vehicles.
Read More →