




Used-Vehicle Inventory, Prices Hold Steady as Sales Edge Higher
Wholesale Used-Vehicle Prices Dip Through July 15
Wholesale supply has increased with weaker purchase activity in early July, yet it is otherwise normal for this time of year.
July 18, 2023
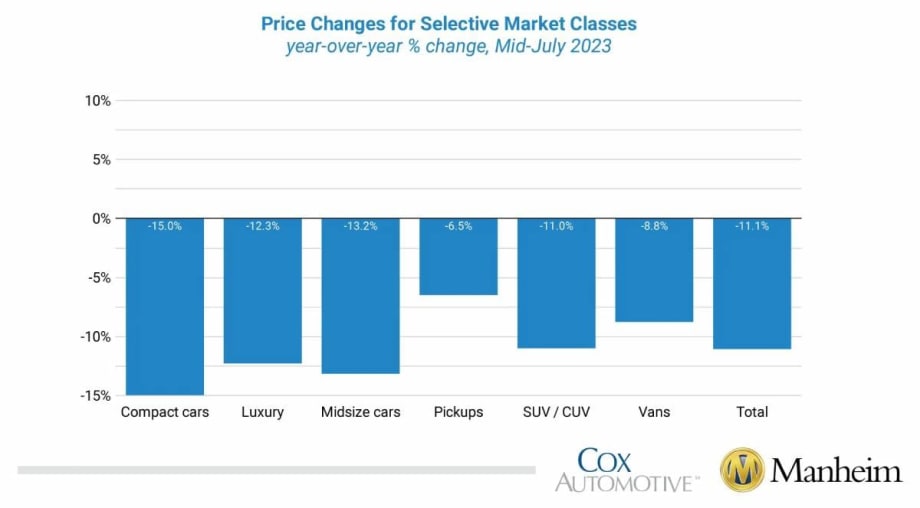
All major segments also saw price decreases compared to June, with losses ranging from 0.5% to 2.1%. Sports cars were again the sole outlier versus the other segments, with a 2.6% gain from June.
Photo: Cox Automotive / Manheim
3 min to read
Wholesale used-vehicle prices (on a mix-, mileage-, and seasonally adjusted basis) decreased 1% from June during the first 15 days of July, according to the midmonth Manheim Used Vehicle Value Index which dropped to 213.1 and fell 11.1% from July 2022. The seasonal adjustment mitigated the decline.
The non-adjusted price change in the first half of July declined 3% compared to June, while the unadjusted price was down 10% year over year.
Over the last two weeks, Manheim Market Report (MMR) prices declined an aggregate of 1.8%, which is an elevated level of decline for the time of year. Over the first 15 days of July, MMR Retention, the average difference in price relative to current MMR, averaged 98.5%, indicating that valuation models remain ahead of market prices.
The average daily sales conversion rate of 47.4% in the first half of July declined relative to June’s daily average of 51.9% and was below the July 2019 daily average of 60.1%.
All major market segments saw seasonally adjusted prices that were lower year-over-year in the first half of July. Pickups lost the least, down 6.5%, followed by vans, down 8.8%.
Compact cars lost the most, at 15%, followed by midsize cars, off 13.2%. All major segments also saw price decreases compared to June, with losses ranging from 0.5% to 2.1%. Sports cars were again the sole outlier versus the other segments, with a 2.6% gain from June.
Retail Supply Lower in Mid-July
Using estimates based on vAuto data as of July 10, used retail days’ supply was 46 days, which was down one day from the end of June. Days’ supply was down six days year over year and down two days compared with the same week in 2019.
Leveraging Manheim sales and inventory data, Manheim estimates that wholesale supply ended June at 25 days, up one day from the end of May and down one day year over year.
As of July 15, wholesale supply was up three days from the end of June at 28 days and up one day year over year but down one day compared to 2019. Used retail supply measured in days’ supply and compared to 2019 suggests supply is tighter than normal for this time of year.
Still, wholesale supply has increased with weaker wholesale purchase activity in early July, yet it is otherwise normal for this time of year.
Rental Risk Prices Decline in First Two Weeks of July
The average price for rental risk units sold at auction in the first 15 days of July was down 7.1% year over year. Rental risk prices were also lower by 5.1% compared to June.
Average mileage for rental risk units in the first half of July (at 58,400 miles) was down 0.7% compared to a year ago but up 2.9% month over month.
Consumer Sentiment Improving in July
The initial July reading on Consumer Sentiment from the University of Michigan increased by 12.7% to 72.6 as views of both current conditions and future expectations increased.
However, the median expected inflation rate over the next year increased to 3.4% from 3.3% last month, and the longer-term view increased by 0.1% to 3.1%, which will concern the Fed. Consumers’ views of vehicle buying conditions improved to the best level since February and were much better than a year ago.
Consumers saw improvement in prices and interest rates but still viewed both negatively. The daily index of consumer sentiment from Morning Consult is little changed so far in July as it has declined 0.2% through July 15 compared to the end of June. Consumers’ expectations of the future remain near the highest daily levels seen since August 2021.
More Used Vehicle Values
Wholesale Used-Vehicle Values Fall as Cox Automotive Cuts 2026 Forecast
Wholesale used-vehicle prices declined in September as depreciation accelerated, prompting Cox Automotive to lower its year-end forecast.
Read More →
Ford Pro Launches Certified Pre-Owned Program for Commercial Vehicles
Ford Pro Advantage will offer certified pre-owned Class 1-7 commercial vehicles through more than 700 Ford Pro Commercial Vehicle Centers.
Read More →
August New-Vehicle Sales Pace Forecast to Hold Above 16 Million
Despite an expected 8.5% year-over-year decline in August volume, Cox Automotive forecasts a 16.3 million SAAR, with full-size pickups outperforming several major crossover segments.
Read More →
Trade Strategy Now Starts Long Before Turn-In
The strongest trade values aren't built at turn-in. Discover how maintenance, lifecycle planning, and shared risk protect truck resale value.
Read More →
What Happens When Residual Values Meet Real-World Markets
A truck's trade value isn't determined on turn-in day. Learn how market cycles, maintenance, and timing shape the gap between residuals and reality.
Read More →
Manheim Index Shows Used-Vehicle Wholesale Prices Up 2.1% in June
The market is seeing stronger appreciation in older used vehicles this year, and the most affordable segments have been among the year’s best performers.
Read More →
Stop Remarketing Electric Vehicles Like Gas Cars
The advantages and attributes of electric vehicles are upending the traditional remarketing cycle, requiring fleet sellers to rely on new factors and approaches detailed below.
Read More →
Used Vehicle Prices Climb Higher As Sales Pace Slows
The higher prices at used retail reflect strong wholesale values earlier in the spring, particularly for older, more affordable vehicles.
Read More →
Wholesale Used Vehicle Market Sustains Moderate Rise In Values, Prices
Trends continue to normalize after a strong start to the year, as consumers contend with higher gas prices in the coming summer months.
Read More →
Used EV Sales Grow In April
While EV sales declined, used EV sales grew, as tighter inventory and rising prices reflected a more normalized pace for the EV market.
Read More →