

More News: Auction Vehicle Supply, Demand Easing Back to Normal
Wholesale Used-Vehicle Prices Rise in January
All eight major vehicle market segments saw seasonally adjusted prices that were lower year over year in January.
February 8, 2023
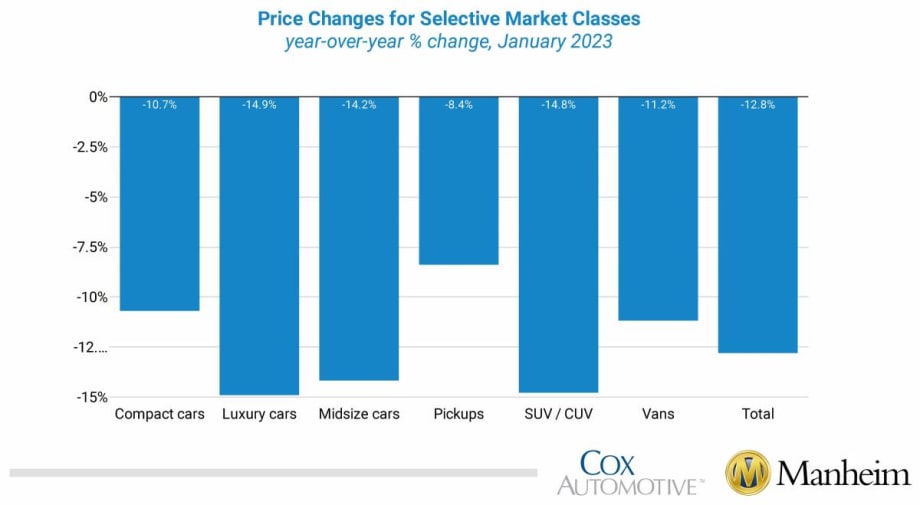
Among vehicle categories, pickups had the smallest decline in prices at 8.4%, followed by compact cars, down 10.7%, and vans, down 11.2%.
Graphic: Cox / Manheim
4 min to read
Wholesale used-vehicle prices (on a mix, mileage, and seasonally adjusted basis) increased 2.5% in January compared to December, accoding to the Manheim Used Vehicle Value Index released Feb. 7. The index rose to 224.8, down 12.8% from a year ago.
January’s increase was driven in part by the seasonal adjustment. The non-adjusted price change in January was an increase of 1.5% compared to December, moving the unadjusted average price down 11% year over year.
In January, Manheim Market Report (MMR) values saw price increases that were not typical, culminating in a 1.2% total increase in the Three-Year-Old Index over the last four weeks. In January, MMR values are typically little changed. In January, daily MMR Retention, which is the average difference in price relative to the current MMR, averaged 99.9%, meaning market prices were very close to MMR values.
The average daily sales conversion rate increased to 59.4% and was above normal for the time of year. For context, the daily sales conversion rate averaged 57.7% in January 2019. The higher conversion rate indicated that the month saw sellers with more pricing power than what is typically seen for this time of year.
All eight major market segments saw seasonally adjusted prices that were lower year over year in January. Pickups had the smallest decline at 8.4%, followed by compact cars, down 10.7%, and vans, down 11.2%. The other five segments’ prices were lower than the industry. Compared to December, six of the eight major segments’ performances were up between 0.8% and 3.6%, with pickups having the strongest showing. Only full-size and luxury cars were down compared to December.
Used Retail Vehicle Sales Up, Days' Supply Down
Leveraging a same-store set of dealerships selected to represent the country from Dealertrack, Cox initially estimates that used retail sales increased 16% in January from December and that used retail sales were up 5% year over year.
Using estimates of used retail days’ supply based on vAuto data, January ended at 44 days’ supply, down from 56 days at the end of December and six days lower than how January 2022 ended at 50 days. Leveraging Manheim sales and inventory data, wholesale supply is estimated to have ended January at 26 days, down six days from the end of December and down five days from how January 2022 ended at 31 days.
January’s total new-light-vehicle sales were up 4.2% year over year, with the same number of selling days as January 2022. By volume, January new-vehicle sales were down 18.6% from December. The January sales pace, or seasonally adjusted annual rate (SAAR), came in at 15.7 million, a 4.1% increase from last year’s 15.1 million and up 17.7% from December’s revised 13.4 million pace.
Combined sales into large rental, commercial, and government fleets were up 58% year over year in January. Sales into rental fleets were up 96% year over year, sales into commercial fleets were up 31%, and sales into government fleets were up 65%. Including an estimate for fleet deliveries into dealer and manufacturer channels, the remaining retail sales were estimated to be up 0.3%, leading to an estimated retail SAAR of 13.2 million, down 0.2 million from last year’s pace, but up 1.7 million from last month’s pace. The fleet share of 16.5% was up 3.3% from last year’s 13.2% share and was up 2.3% from last month’s 14.2% share.
Rental Risk Prices Mixed
The average price for rental risk units sold at auction in January was down 7.6% year over year. Rental risk prices were up 2.8% compared to December. Average mileage for rental risk units in January (at 55,800 miles) was down 5.9% compared to a year ago but up 0.2% from December.
Consumer Confidence Improves Slightly
The Conference Board Consumer Confidence Index declined 1.7% in January, as views of present situation improved but future expectations fell by 6.7%. Plans to purchase a vehicle in the next six months were unchanged from December and were down slightly year over year. The confidence index did not decline as much during the pandemic as the sentiment index from the University of Michigan, but that series improved in January. The Michigan index increased 8.7%, driven primarily by improvement in the view of current conditions, which was up 15.2%. Consumers’ views of buying conditions for vehicles improved to the best level since July 2021.
The daily index of consumer sentiment from Morning Consult measured modestly declining sentiment in January, as that index declined 1.5% for the month. Sentiment declined in January as the price of gasoline increased. According to AAA, the national average price for unleaded gas increased 9% in January to $3.50 per gallon on Jan. 31, which was up 4% year over year.
More Used Vehicle Values
Used Vehicle Prices Climb Higher As Sales Pace Slows
The higher prices at used retail reflect strong wholesale values earlier in the spring, particularly for older, more affordable vehicles.
Read More →
Wholesale Used Vehicle Market Sustains Moderate Rise In Values, Prices
Trends continue to normalize after a strong start to the year, as consumers contend with higher gas prices in the coming summer months.
Read More →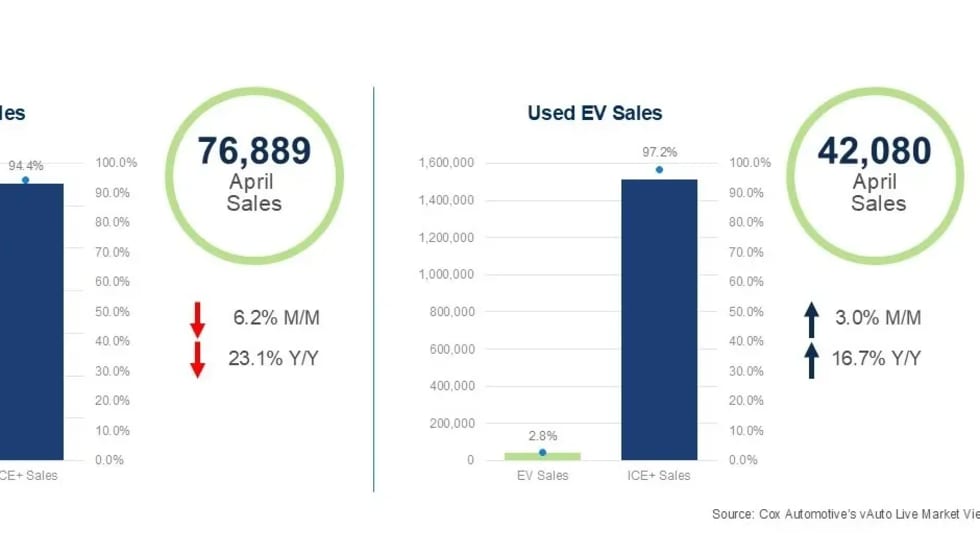
Used EV Sales Grow In April
While EV sales declined, used EV sales grew, as tighter inventory and rising prices reflected a more normalized pace for the EV market.
Read More →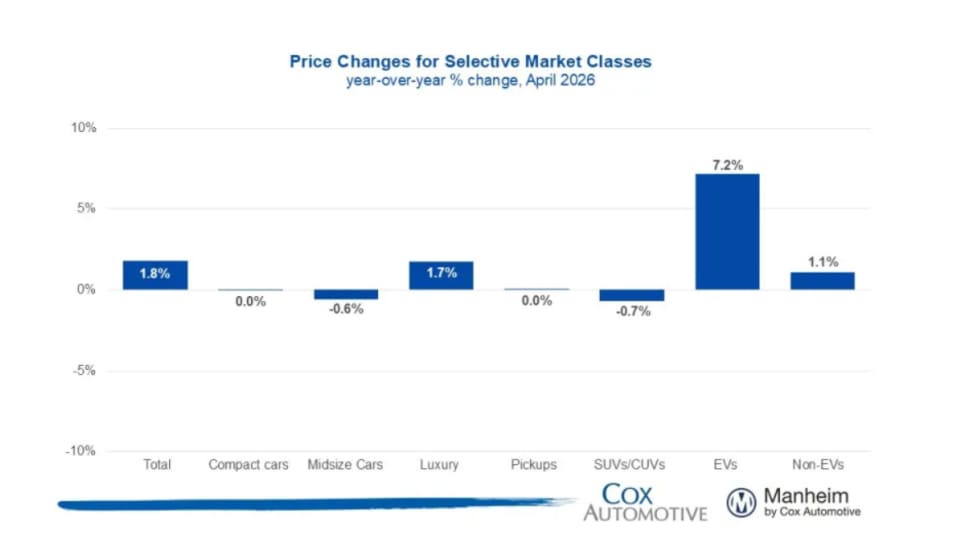
Wholesale Used Vehicle Prices Slightly Up In April
The Iranian conflict and rising gas prices inject much uncertainty into the future wholesale used vehicle markets, as higher gas prices soak up spendable income from vehicle buyers.
Read More →
CAR 2026 Recap Part 2: Closing the Gap Between Data & Remarketing Value
The second half of CAR 2026 examined how fleets can translate lifecycle strategy, vehicle data, and market shifts into higher real-world results.
Read More →
CAR2026 in Two Words: Velocity, Value (Part 1)
The 2026 Conference of Automotive Remarketing convened with a mandate to involve a new constituency — fleet managers — and an updated mission to demonstrate unrealized value in de-fleeted vehicles.
Read More →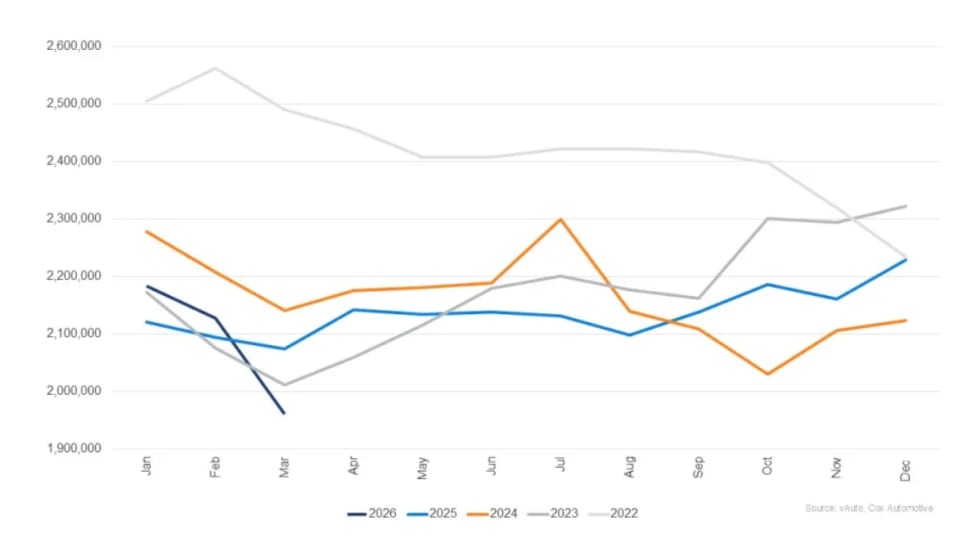
March Used Vehicle Inventory Falls To Lowest Since 2019
Franchised and independent dealers had a total of 1.95 million used vehicles in stock in March, the lowest on record in the current data set.
Read More →
Spring Bounce Pushes Q1 Used Vehicle Values Higher
Demand signals remain strong at auctions, with sales conversions, a clear sign of demand, reaching 68.2% in the most recent measure.
Read More →
CAR 2026: Get the Wall Street Update on the Key Players in Remarketing
From a Wall Street analyst's take on remarketing's key players to whether fleets need their own version of Carfax, CAR 2026's afternoon roundtables will answer key operational and industry questions.
Read More →
CAR 2026 Session to Uncover the Missing Data That's Costing Fleets at Disposal
Work trucks lose value at remarketing, not because they aren't worth more, but because the data to prove it rarely makes it to the auction.
Read More →