
First Quarter 2013 Used Commercial Vehicle Transactions Up Nearly 5 Percent
Recent Polk analysis of commercial vehicle registrations during the first quarter of the 2013 calendar year identified 171,724 used commercial vehicle registrations, an increase of 4.7 percent when compared to used registrations during the first quarter, 2012.
Recent Polk analysis of commercial vehicle registrations during the first quarter of the 2013 calendar year identified 171,724 used commercial vehicle registrations, an increase of 4.7 percent when compared to used registrations during the first quarter, 2012. With the exception of first quarter 2011, used registrations in the first quarter of the 2013 calendar year are the highest since 2005. During this same period, new commercial vehicle registrations were down 4.4 percent.
"This is a significant development for the market, in that while new registrations are soft, when compared to the same quarter in the previous calendar year or with the level of new registrations during the last quarter of 2012, there is still solid demand for used commercial vehicle equipment," said Gary Meteer, director, aftermarket and commercial vehicle solutions at Polk. "Since smaller businesses and individual owners are the primary purchasers of used equipment, the strong demand is an indication that these companies are positive and confident about their business, and therefore replacing older equipment or adding vehicles to their fleet."
Used commercial vehicle transactions during the first quarter of 2013, when compared to the first quarter of 2012, were strong in each GVW category, as follows:
USED COMMERCIAL VEHICLE REGISTRATIONS FOR Q1 2013 | |||
|---|---|---|---|
VIN-Defined Gross Vehicle Weight | Q1 2013 Used Transactions | Percentage Change from Q1 2012 | Q1 2013Share of Used Commercial Vehicles (%) |
GVW 3 | 52,153 | 6.5 | 30.4 |
GVW 4 | 15,306 | 4.0 | 8.9 |
GVW 5 | 8,841 | 10.5 | 5.1 |
GVW 6 | 14,657 | 4.6 | 8.5 |
GVW 7 | 13,489 | 3.9 | 7.9 |
GVW 8 | 67,278 | 3.0 | 39.2 |
INDUSTRY TOTAL | 171,724 | 4.7 | 100.0 |
Used commercial vehicle transactions accounted for about 57.1 percent of total registrations during the first quarter, 2013. The share of total commercial vehicle registrations accounted for by used transactions continues to decline from a high of 70 percent in the first quarter of the 2011 calendar year. A historical quarterly view is as follows:
USED COMMERCIAL VEHICLE REGISTRATIONS (GVW 3-8) SHARE (%) OF TOTAL VEHICLE REGISTRATIONS | |||||||
|---|---|---|---|---|---|---|---|
2007 | 2008 | 2009 | 2010 | 2011 | 2012 | 2013 | |
QTR 1 | 45 | 48 | 58 | 66 | 70 | 56 | 57 |
QTR 2 | 43 | 47 | 66 | 68 | 69 | 56 | |
QTR 3 | 50 | 49 | 67 | 64 | 60 | 54 | |
QTR 4 | 47 | 49 | 61 | 60 | 54 | 55 | |
Polk's most recent Commercial Quarterly Commercial Report is available for download and includes additional detail and insight into the used and new commercial vehicle market activity for the first quarter.
Polk has been providing commercial vehicle data to the industry for decades and first began reporting used and new registration information in 2004. Polk's solutions for the commercial market also include the ability to pinpoint business owners who have purchased used equipment and are therefore good prospects for future purchases. Solid name lists based on ownership profiling is one of the many services Polk provides to customers who are looking to expand their new and used vehicle business.
More Operations
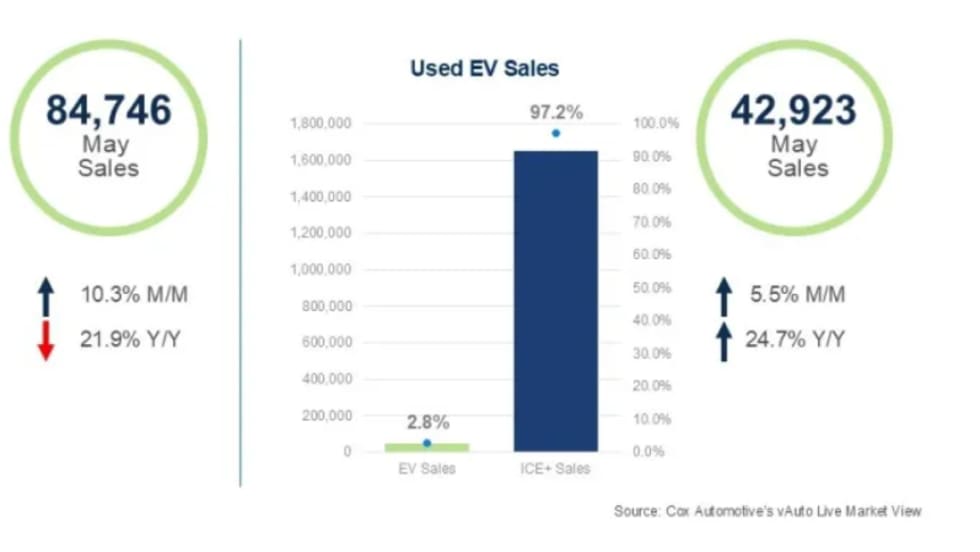
Used EVs Strengthen Overall Electric Vehicle Market
The latest sales data point to several reasons for the divergent trends in new and used EVs that can factor into fleet cycling decisions.
Read More →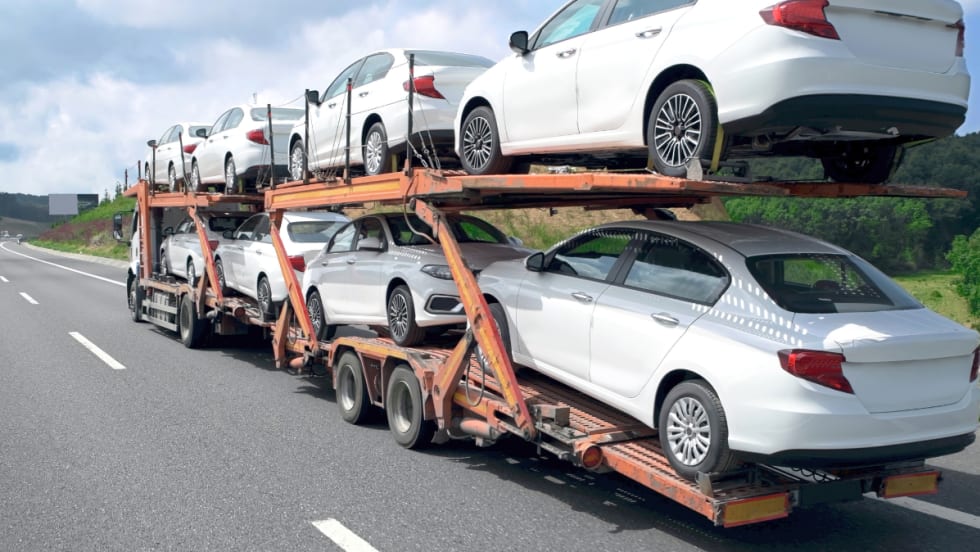
The Data-Driven Haul: 5 Ways AI is Leveling the Playing Field in Auto Transport
Large and small transport fleets are becoming more competitive as predictive analytics and real-time data inform the logistics decision chain.
Read More →
How to Speak the Same Language on Fleet Safety
Drivers, supervisors, and data often speak different safety “languages.” Getting on the same page will drive better results.
Read More →
2026 CAR Awards Celebrate Industry Excellence
CAR’s annual Fleet Remarketing Awards opened a reimagined 2026 conference designed to bridge the worlds of fleet management and automotive remarketing.
Read More →
The Predictive Pivot: How AI and Data Are Redefining Auto Logistics in 2026
AI is no longer a luxury but the baseline for profitability in 2026. Auto haulers that adopt these tools now will quickly outpace those using manual workflows and taking a wait-and-see approach.
Read More →
The Predictive Pivot: How AI and Data Are Redefining Auto Logistics in 2026
AI is no longer a luxury but the baseline for profitability in 2026. Auto haulers that adopt these tools now will quickly outpace those that use manual workflows or take a wait-and-see approach.
Read More →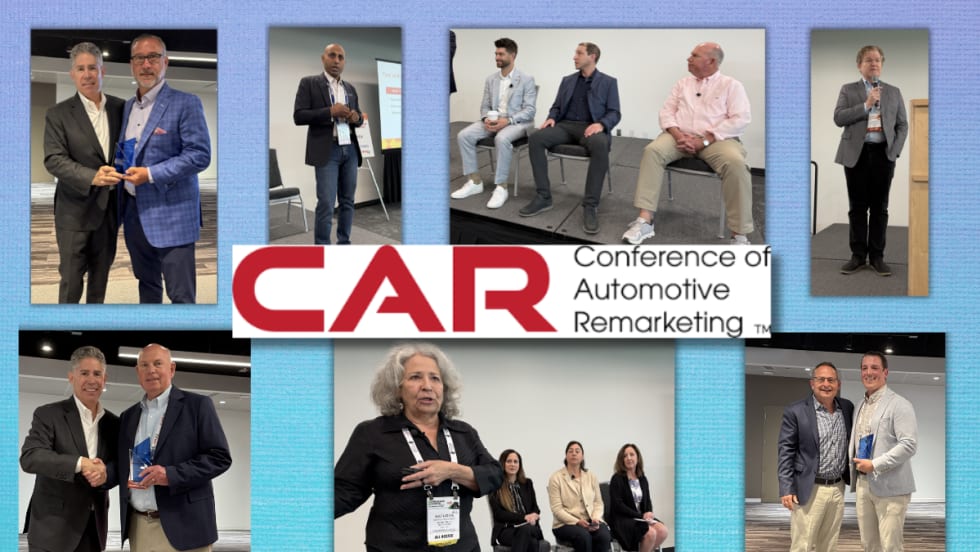
CAR 2026 Recap Part 2: Closing the Gap Between Data & Remarketing Value
The second half of CAR 2026 examined how fleets can translate lifecycle strategy, vehicle data, and market shifts into higher real-world results.
Read More →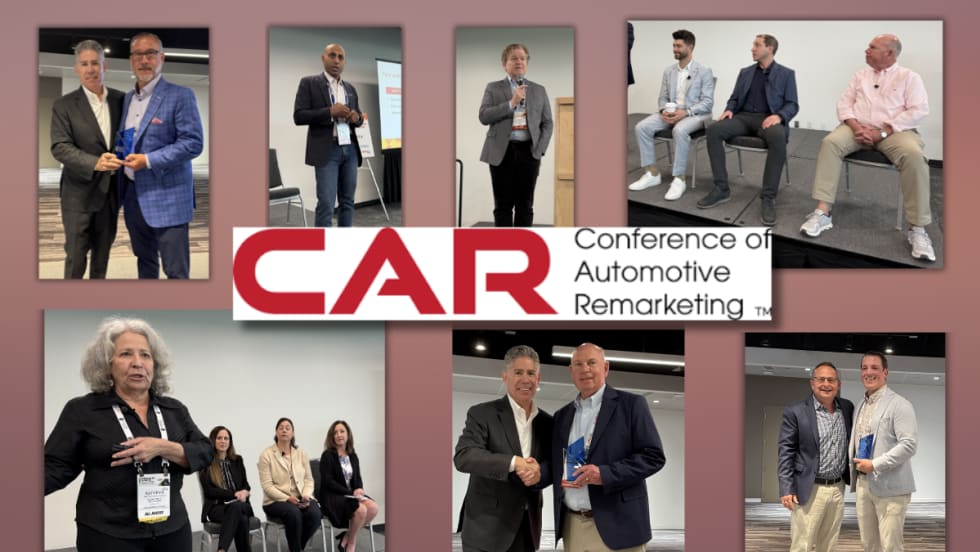
CAR2026 in Two Words: Velocity, Value (Part 1)
The 2026 Conference of Automotive Remarketing convened with a mandate to involve a new constituency — fleet managers — and an updated mission to demonstrate unrealized value in de-fleeted vehicles.
Read More →
CAR 2026: Get the Wall Street Update on the Key Players in Remarketing
From a Wall Street analyst's take on remarketing's key players to whether fleets need their own version of Carfax, CAR 2026's afternoon roundtables will answer key operational and industry questions.
Read More →
CAR 2026 Session to Uncover the Missing Data That's Costing Fleets at Disposal
Work trucks lose value at remarketing, not because they aren't worth more, but because the data to prove it rarely makes it to the auction.
Read More →