



Black Book Says Overall Used-Car Depreciation Just -0.1% During April
Black Book recently released a new analysis of vehicle depreciation rates, noting that April generally is the end of the spring buying season for used cars and that this was the case last month.
Black Book recently released a new analysis of vehicle depreciation rates, noting that April generally is the end of the spring buying season for used cars and that this was the case last month.
The company said used cars overall depreciated -0.1 percent on the month. Domestic cars increased 0.2 percent; import cars dropped -0.2 percent; domestic trucks were up 0.1 percent; and import trucks were down -0.2 percent, according to the company.
Black Book noted that vehicles in its Entry-Level Cars category saw the biggest gains, up 1.5 percent in value. Vehicles in the category include the Chevrolet Aveo, the Honda Fit, the Kia Rio, the Nissan Versa, and the Toyota Yaris. The average segment value at the April was $7,792.
Minivans saw the largest gain in the truck segments during April, up 2.7 percent for the month. These vehicles include the Dodge Caravan, Ford Transit Connect, and the Chevrolet Uplander. The average segment value at the end of April was $9,927.
The Full-Size Crossovers and Luxury SUV categories depreciated the most in Black Book’s truck segments, both falling 0.7 percent during April. Crossovers in this category include the GMC Acadia, the Buick Enclave, the Ford Flex, and the Chevrolet Traverse. SUVs include the Cadillac Escalade, Toyota Land Cruiser, Lincoln Navigator, and the BMW X5.
The Prestige Luxury Car category saw the most depreciation, according to Black Book, with the overall category falling 1.1 percent in value. Vehicles in this segment include the BMW 7 Series, the Audi A8, the Lexus GS430, the Mercedes-Benz S-Class, and the Jaguar XJ. The average segment value at the end of April was $32,938.
The chart below shows a breakdown of value changes of used vehicles:
Bodystyle | 5/1/2012 | 4/1/2013 | 1M Chg | 5/1/2013 | 12M Chg | 12M Chg |
|---|---|---|---|---|---|---|
All Vehicles | $20,669 | $17,979 | -0.10% | $17,956 | ($2,712) | -13.10% |
Domestic | $14,592 | $12,403 | 0.20% | $12,424 | ($2,168) | -14.90% |
Domestic Truck | $17,467 | $15,999 | 0.10% | $16,011 | ($1,455) | -8.30% |
Import | $22,595 | $19,265 | -0.20% | $19,222 | ($3,373) | -14.90% |
Import Truck | $23,811 | $20,611 | -0.20% | $20,564 | ($3,246) | -13.60% |
Compact Pickup | $16,176 | $15,144 | 0.20% | $15,174 | ($1,003) | -6.20% |
Compact SUV | $16,848 | $15,370 | 1.40% | $15,580 | ($1,268) | -7.50% |
Compact CUV | $15,572 | $13,534 | 0.40% | $13,584 | ($1,988) | -12.80% |
Entry Level Car | $9,476 | $7,676 | 1.50% | $7,792 | ($1,684) | -17.80% |
Entry Mid-Size Car | $12,235 | $10,046 | -0.20% | $10,031 | ($2,204) | -18.00% |
Sporty Car | $21,936 | $19,172 | -0.10% | $19,153 | ($2,783) | -12.70% |
Full-Size Pickup | $23,221 | $21,975 | 0.30% | $22,036 | ($1,185) | -5.10% |
Full-Size Car | $15,005 | $12,869 | 0.00% | $12,874 | ($2,131) | -14.20% |
Full-Size SUV | $21,626 | $19,577 | -0.50% | $19,470 | ($2,155) | -10.00% |
Full-Size Van Cargo | $13,253 | $12,020 | 0.30% | $12,054 | ($1,199) | -9.00% |
Full-Size Vans Wagon (Pass) | $14,169 | $12,729 | 0.30% | $12,765 | ($1,404) | -9.90% |
Full-Size CUV | $24,559 | $20,904 | -0.70% | $20,753 | ($3,806) | -15.50% |
Luxury Level Car | $24,331 | $21,159 | -0.20% | $21,109 | ($3,221) | -13.20% |
Luxury SUV | $38,107 | $33,149 | -0.70% | $32,930 | ($5,177) | -13.60% |
Mid-Size Pickup | $16,779 | $15,602 | 0.50% | $15,678 | ($1,101) | -6.60% |
Mid-Size SUV | $19,055 | $17,250 | -0.10% | $17,237 | ($1,818) | -9.50% |
Mini Van Cargo | $11,044 | $9,663 | 2.70% | $9,927 | ($1,117) | -10.10% |
Mini Van Wagon (Pass) | $15,820 | $13,389 | -0.30% | $13,351 | ($2,468) | -15.60% |
Mid-Size CUV | $21,378 | $18,250 | -0.30% | $18,197 | ($3,181) | -14.90% |
Near Luxury Car | $18,239 | $15,460 | -0.10% | $15,443 | ($2,796) | -15.30% |
Prestige Luxury Car | $39,638 | $33,313 | -1.10% | $32,938 | ($6,700) | -16.90% |
Premium Sporty Car | $50,360 | $43,240 | -0.60% | $42,996 | ($7,365) | -14.60% |
Compact Car | $11,057 | $9,015 | 1.10% | $9,110 | ($1,947) | -17.60% |
Upper Mid-Size Car | $13,269 | $11,008 | 0.40% | $11,052 | ($2,217) | -16.70% |
Originally posted on Automotive Fleet
More Operations

FLD Promotes Three Executives in Leadership Changes
FLD has promoted three longtime executives, naming Gary Mott CEO, Richard Mallek president, and Ron Sanders managing partner.
Read More →
CAS Automotive Launches Remarketing Service for Damaged, Surplus Equipment
Damaged Equipment expands CAS Automotive’s vehicle remarketing model to commercial equipment, targeting fleet operators, insurers, equipment dealers, and rental companies.
Read More →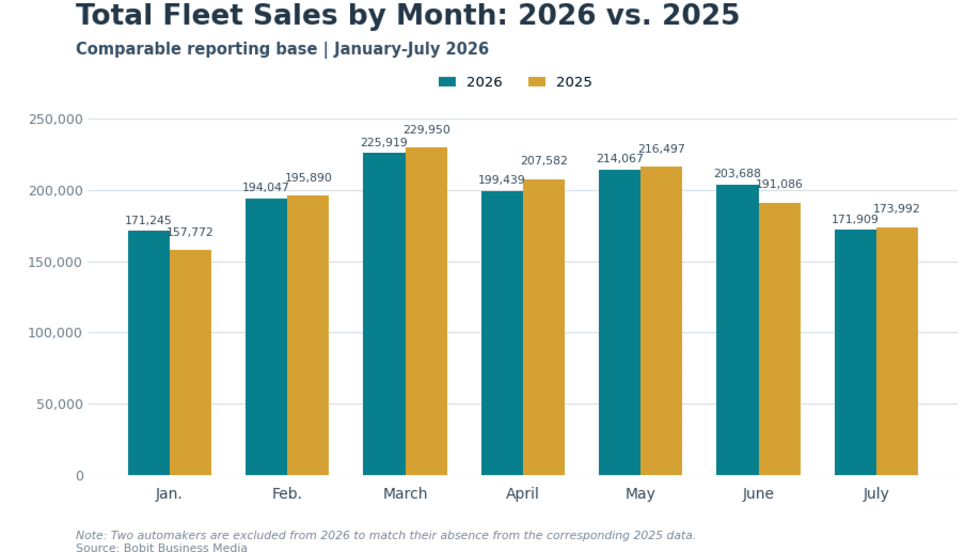
Fleet Sales Hold Steady as Commercial Gains Offset Rental Decline
Commercial and government fleet sales increased through July 2026, offsetting most of the decline in rental volume and leaving combined comparable fleet sales 0.5% above the same period last year.
Read More →
Personnel Update: BrickHouse GPS, PRO-VISION, Auto Driveaway, and Proaction
Check out the latest must-know fleet personnel updates from the last couple of months.
Read More →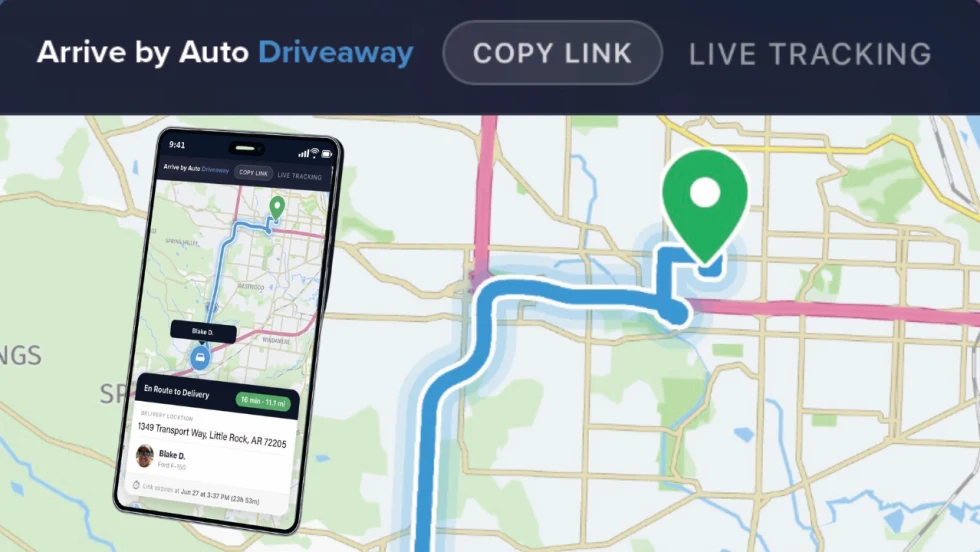
What Comes Next for Auto Driveaway?
A new Auto Driveaway feature called Arrive provides recipients with live location updates and ETAs during the final hour of a vehicle move, while fleet customers continue to have end-to-end shipment visibility through the company's customer portal.
Read More →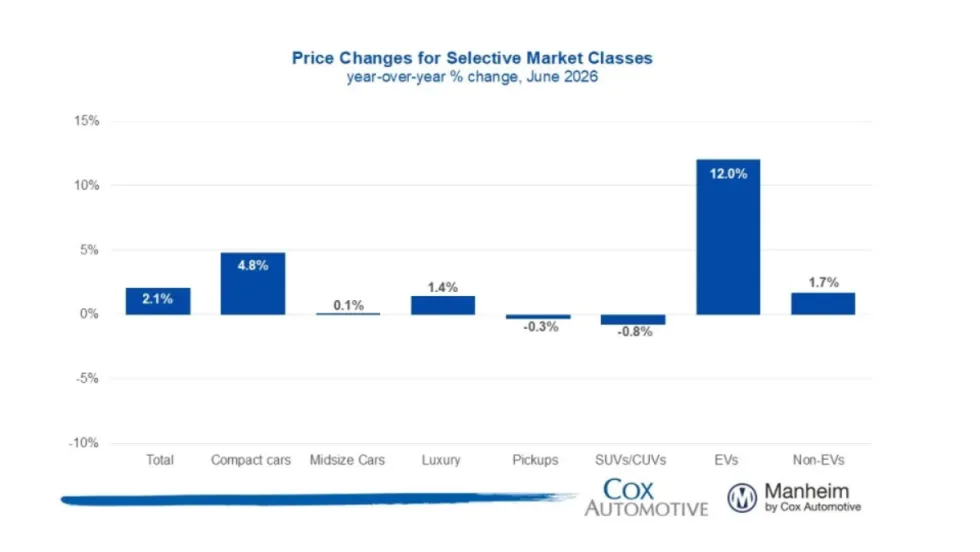
Manheim Index Shows Used-Vehicle Wholesale Prices Up 2.1% in June
The market is seeing stronger appreciation in older used vehicles this year, and the most affordable segments have been among the year’s best performers.
Read More →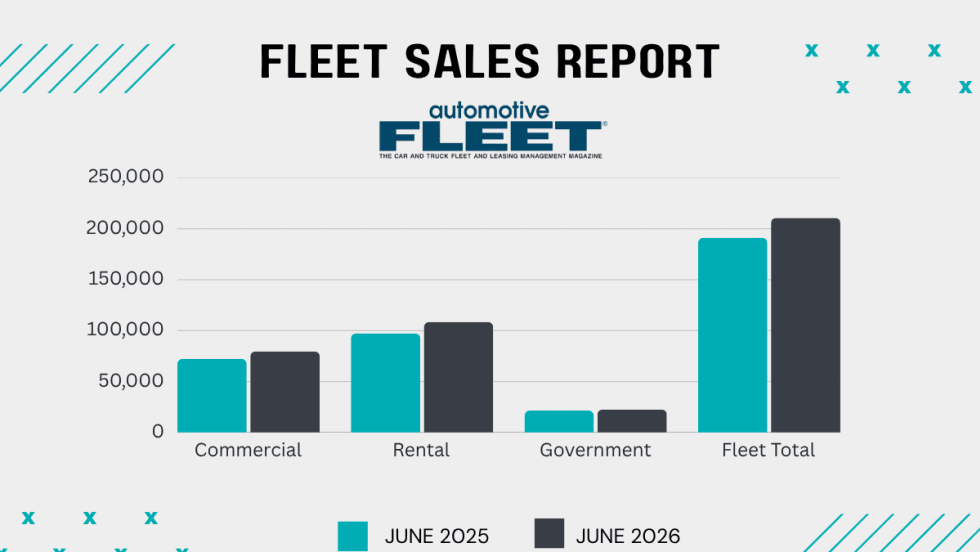
Commercial Fleet Sales Contribute To June, YTD Gains
The fleet sector has boosted its vehicle purchases at a reliable pace in the first half of this year compared with 1H 2025.
Read More →
Stop Remarketing Electric Vehicles Like Gas Cars
The advantages and attributes of electric vehicles are upending the traditional remarketing cycle, requiring fleet sellers to rely on new factors and approaches detailed below.
Read More →
AP Fleet Management Expands Remarketing Program for Commercial Work Trucks
AP Fleet Management expanded its commercial vehicle remarketing program with dedicated resale services and an online marketplace for used work trucks.
Read More →
Used EVs Strengthen Overall Electric Vehicle Market
The latest sales data point to several reasons for the divergent trends in new and used EVs that can factor into fleet cycling decisions.
Read More →